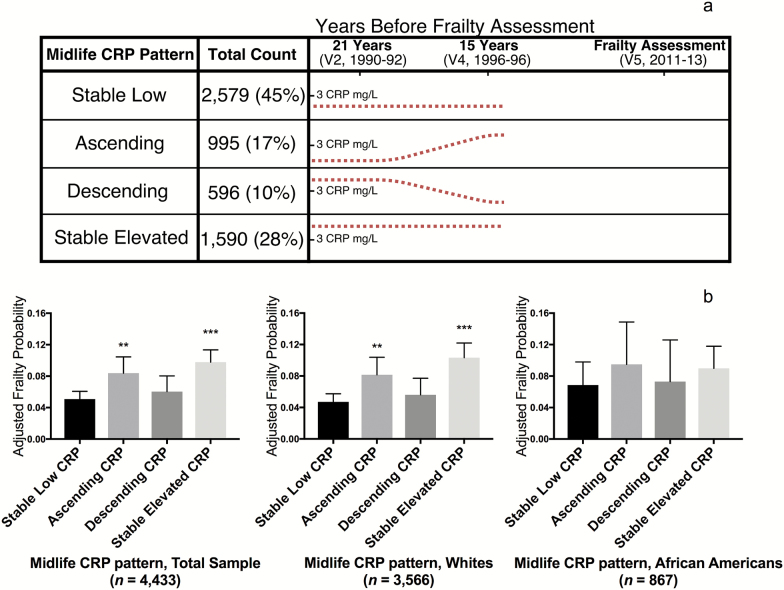
Figure 2.
Participant grouping and the adjusted probability of frailty based on longitudinal midlife CRP levels. (a) Using 3 mg/L as the cutoff for elevated versus normal CRP, participants were assigned to one of four groups based on CRP levels at Visits 2 and 4. Estimated CRP patterns for each group are represented by the dotted line. (b) Using multivariable logistic regression, covariate-adjusted probabilities of late-life frailty were calculated for the total sample and for white and African American subgroups. The logistic regression model adjusted for demographic and physiological variables, as well as medical comorbidity at Visit 2. **p < .01, ***p < .001 compared to the Stable Low referent group. CRP = C-reactive protein.

