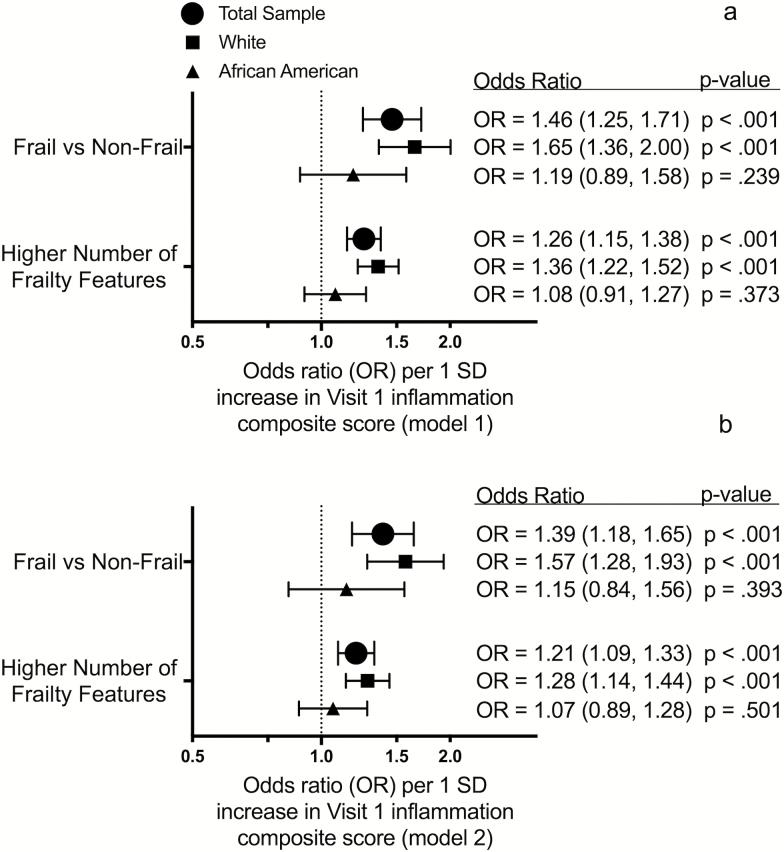
Figure 3.
The association between midlife inflammation composite score and odds of late-life frailty. Forest plots display the odds ratios for the association of Visit 1 inflammation composite score with frailty and frailty features at Visit 5 after adjusting for demographic and physiological characteristics (a) and comorbidity (b). OR = Odds ratio.

