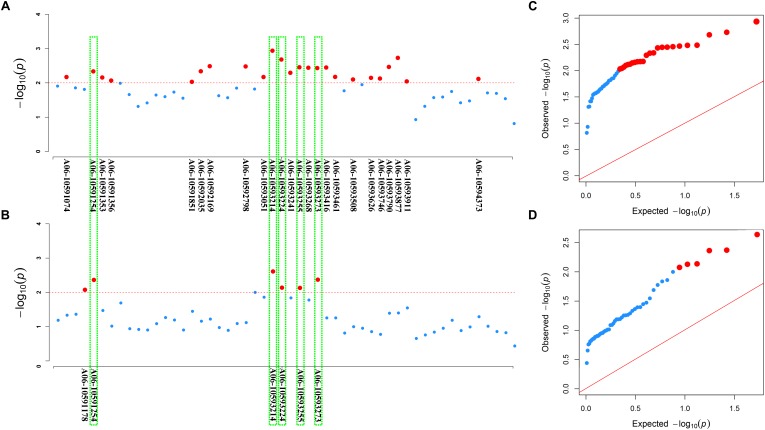
FIGURE 7.
Association of SNP polymorphisms with disease index or disease incidence rate across the BnaA06g18440D locus of BnaMPK3. (A) Manhattan plot for disease index or (B) disease incidence rate. The threshold of association analysis was set to P < 0.01. The red-dotted line was –log10(p) = –log10(0.01) = 2.0, and the red dot above the red-dotted line represents a significantly associated SNP. The red dots in the green box are significantly associated SNPs for both disease index and disease incidence rate. (C) The Q–Q plots for disease index or (D) disease incidence rate from association analysis. The red line was the unbiased estimates of the expected and observed value. Red dots were the significant SNPs.

