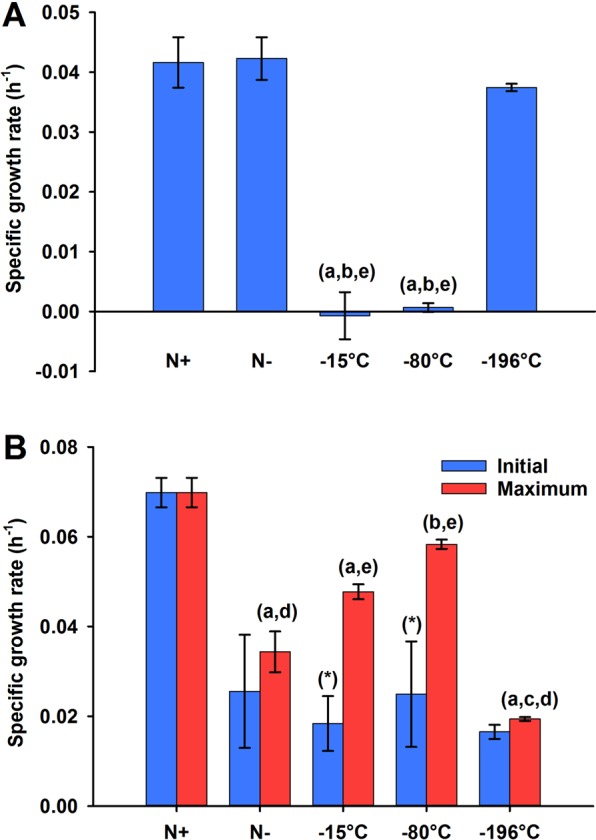
Figure 3.

Specific growth rates (h−1) observed during 0–24 h in Phase 1 (A), and at “Initial” (0–4 h) and “Maximum” (over 0–72 h) in Phase 2 (B). The specific growth rates were measured as μ = ln(Xt/X0)/(tt − t0), Xt and X0 being the biomass concentrations (as OD595nm) at time points t hours (tt) and 0 hours (t0), respectively. Mean (±standard error) values of three biological replicates are plotted. Analysis of the variance followed by the Bonferroni post hoc test (p-value < 0.05) was carried out to estimate the significance of the differences between the treatments (i.e., (a) significant difference when compared with Control N replete, (b) significant difference when compared with Control N free, (c) significant difference when compared with −15 °C treated populations, (d) significant difference when compared with −80 °C treated populations and (e) significant difference when compared with −196 °C treated populations). In (B) the ANOVA between treatments was carried out for the maximum growth rates and between the “Initial” and the “Maximum” growth rates within the same treatment, (*) meaning significant difference between the two types of rate for each treatment.
