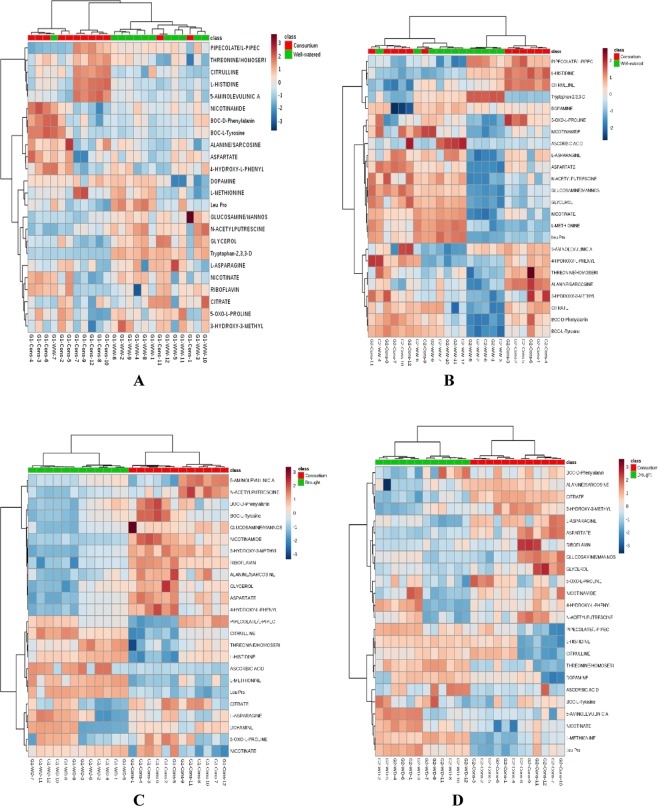
Figure 7.
Heat maps, (A) (consortium vs well-watered for drought sensitive variety Punjab Noor-2009), (B) (consortium vs well-watered for drought tolerant variety 93127), (C) (consortium vs drought for drought sensitive variety Punjab Noor-2009), and (D) (consortium vs drought for drought tolerant variety 93127), are illustrating top metabolites at two time points. The heat maps were generated based on using Pearson and Ward for distance measure and clustering algorithm, respectively. Metabolite feature areas were normalized and range-scaled across all experimental samples at two different time points.

