Figure 2.
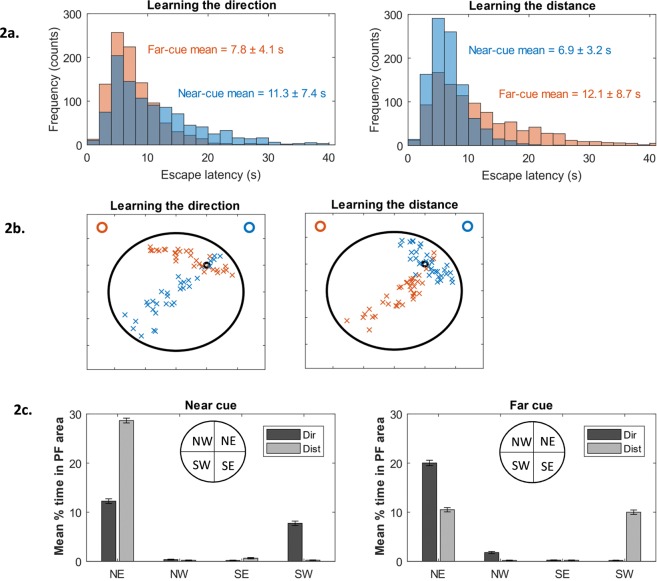
(a) Learning the direction (left panel) from the Far cue (red bars) results in shorter escape latencies compared to learning the direction from the Near cue (blue bars). Learning the distance (right panel) from the Far cue (red bars) results in longer escape latencies compared to learning the distance from the Near cue (blue bars). (b) Platform guesses using directional information (left panel) from the Far cue results in searching along the NW-NE axis (red crosses). Platform guesses using directional information from the Near cue results in searching along the NE-SW axis of the pool (blue crosses). Platform guesses using distance information (right panel) from the Far cue results in searching along the NE-SW axis of the pool (red crosses), while using distance from the Near cue results in searching confined mainly to the NE quadrant (blue crosses). Location of the two cues (Far and Near) represented by the red and blue circles, respectively. (c) Quantification of the platform guesses from (b) demonstrating differences in mean time spent in the NE target region depending on the location of the cue (Near vs Far) and whether direction (dark bars) or distance (light bars) information is used.

