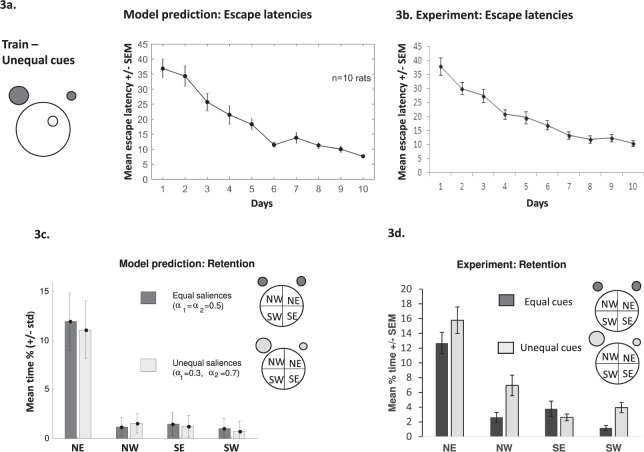
Figure 3.
(a) Simulated escape latencies using two cues of unequal brightness. Inset: representation of the water maze with the two cues (grey circles) located in the NE and NW regions surrounding a circular pool of water with the hidden platform located in the NE quadrant of the pool (white circle). The larger grey circle represents the brighter cue. Line graph depicting the decrease in mean escape latencies of simulated animals across 10 days of learning (4 trials/day). (b) Line graph showing a decrease in mean escape latencies (with standard error bars) of experimental animals across 10 days of training (4 trials/day) with cues of unequal brightness. Simulated (c) and experimental (d) animals show good retention using cues of unequal (light grey bars) or equal brightness (dark grey bars) with both searching more in the targeted NE region compared to other equivalent areas of the pool. Experimental data is taken from Farina et al. (2015).

