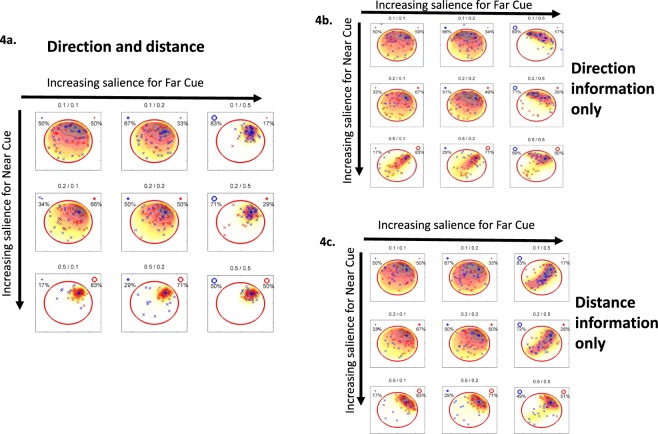
Figure 4.
(a) Heat-maps showing the distribution of the inferred platform location (illustrative of how the pattern of searching changes) as the salience of one or both cues increases if both direction and distance is learned (a), just direction (b) or just distance (c). The percentage beside each cue refers to the relative saliency of one cue to the other, for example, if both are equal then the ratio is 50%:50%, if one is more salient than the other then the ratio is 83%:17%. The number above each plot refers to the strength of saliency with 0.1 being relatively weak which increases to 0.5 representing strong saliency. x-marks are examples of guessed/inferred platform locations based on the learned distance and direction information of the far (blue) and near (red) cue.

