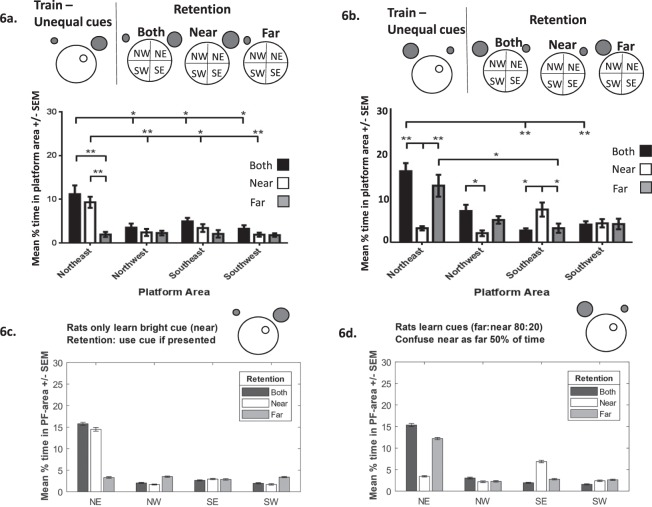
Figure 6.
(a) Experimental data (from Farina et al., 2015) depicting the searching patterns of animals following training with two cues of unequal brightness (the brighter cue is located in Near position, represented by the larger grey circle). During retention when presented with the brighter Near cue animals search mainly in the NE quadrant (white bars). When presented with the dimmer Far cue animals’ search is random (grey bars). (b) Searching patterns of animals following training with two cues of unequal brightness (the brighter cue is now located in the Far position, represented by the larger grey circle). During retention when presented with the dimmer Near cue animals mainly search in the SE quadrant (white bars). When presented with the brighter Far cue animals search in the NE quadrant (grey bars). Figure adapted from Farina et al. (2015). (c) Simulation in which the rats ignore the dim-far cue (salience α2 = 0) explains the data in (a). Here the salience of the near-bright cue is so high (because of its location and brightness) that it completely dominates the dim-far cue. (d) Simulations in which the rats partially misinterpret the dim-near cue as the far-bright cue when they are only presented with the dim-near cue, explain the data in (b). In this model, the bright-far cue achieves salience because of its brightness (α2 = 0.8) but the near cue also achieves some salience because of its location (α1 = 0.2). As a consequence of its high salience, the bright-far cue is learned well, and when presented with the bright-far cue, the rats use it correctly (grey bars). In contrast, because of its low salience, the dim-near cue is not learned well, and the rat tends to misinterpret it as the far cue (50% of the time in this model, white bars).

