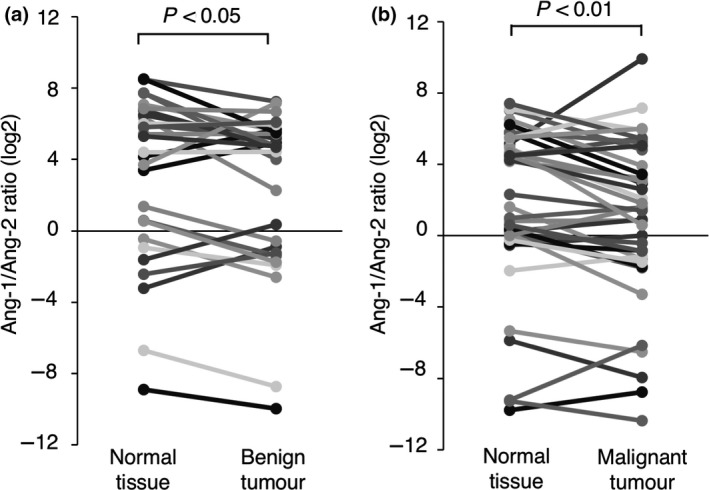
Figure 5.

The expression ratio of Ang‐1 to Ang‐2 in canine tumour tissues and the normal tissues surrounding each tumours. (a) The Ang‐1 to Ang‐2 gene expression ratio in benign tumour tissues and the normal tissues surrounding each tumours. (b)The Ang‐1 to Ang‐2 gene expression ratio in malignant tumour tissues and the normal tissues surrounding each tumours. The gene expression ratio in each tissue is represented by log2. The gene expression ratio was compared between tumour tissues and the normal tissues surrounding each tumours using the Wilcoxon rank‐sum test.
