FIGURE 2.
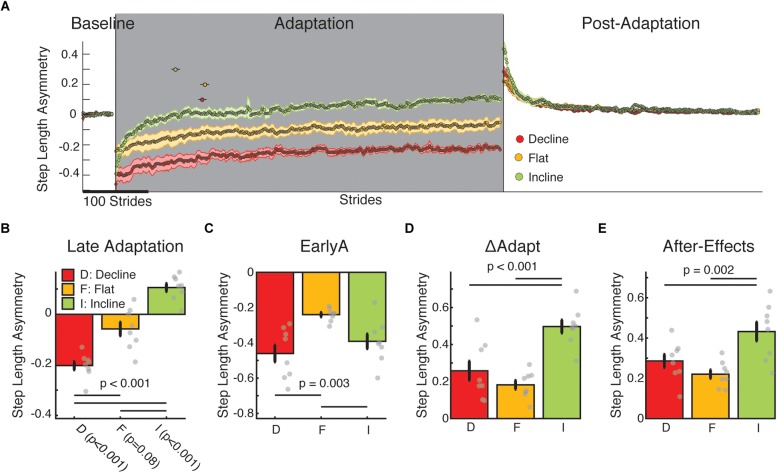
Step length asymmetry adaptation and after-effects. (A) Stride-by-stride time course of step length asymmetry during medium baseline, adaptation, and post-adaptation are shown. Each data point represents the average of 5 consecutive strides and shaded regions indicate the standard error for each group. The dots above the time courses indicate the time constants with 95% confidence intervals. Note that the incline group adapted more quickly than the other sloped conditions as indicated by the smaller time constant (τ) and not overlapping 95% confidence interval for this group compared to the other two groups [incline: 132.0 strides (125.6–138.4); flat: 135.6 strides (128.8–142.4); decline: 91.3 strides (84.7–97.9)]. These time constants are reflective of the data given that the exponential fits were able to characterize the data well (incline: R2 = 0.86; flat: R2 = 0.94; decline: R2 = 0.95). (B–E) We display group average values for outcome measures using step length asymmetry ± standard errors. Thin horizontal lines between groups illustrate significant differences (p < 0.05) based on post hoc analysis and gray dots indicate values for individual subjects. (B) Late adaptation: The height of the bars indicates group average step length asymmetry during late adaptation ± standard errors. Note that each group plateaued at different step length asymmetry values and the incline and decline groups had steady states statistically different from symmetry. Individual t-tests are reported on the x-axis. (C) EarlyA: The height of the bars indicates group average step length asymmetry during early adaptation ± standard errors. The sloped groups (both incline and decline) were more perturbed than the flat group by the split-belt perturbation. (D) ΔAdapt: The height of the bars indicates group average change of step length during the adaptation epoch ± standard errors. The incline group modulates their step length asymmetry more during adaptation than the flat or decline group. (E) After-effects: The height of the bars indicates group average step length after-effects early in the post-adaptation epoch ± standard errors. Again, the incline group had greater locomotor after-effects than the flat or decline groups.

