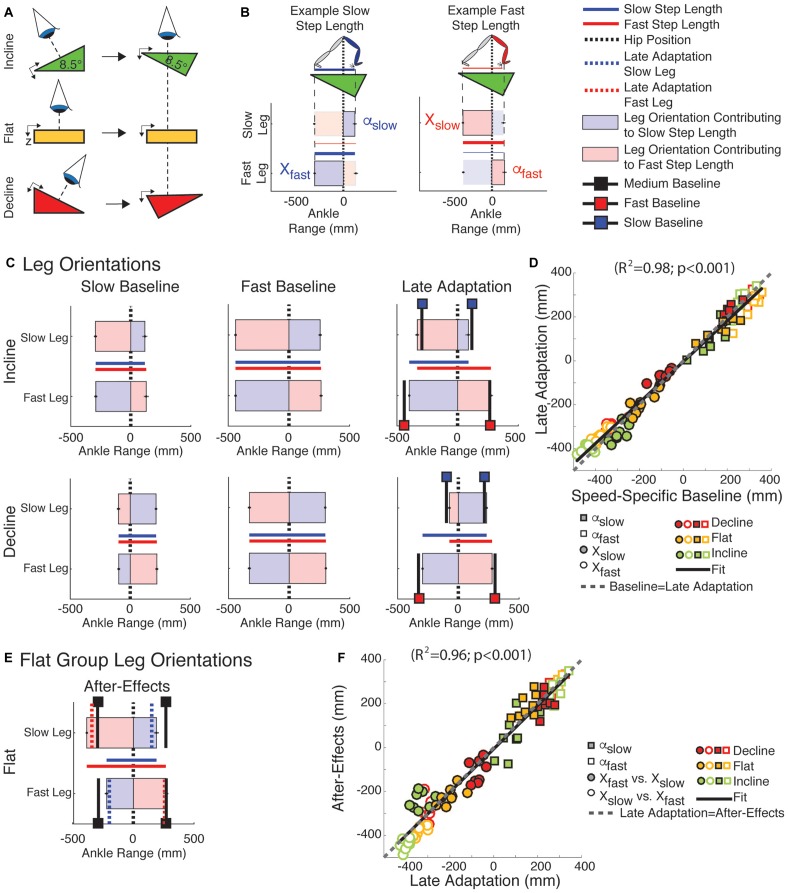
FIGURE 4.
Leg orientation adaptation and after-effects. (A) Schematic indicating the view projected in (B–F). (B) Visualization used in (C,E). Vertical zero lines represent the perpendicular projection of the hips onto the treadmill. The horizontal bars represent the ankle positions with respect to the hips at ipsilateral and contralateral heel strikes ± standard errors. The leading and trailing leg’s orientation (α and X, respectively) at heel strike are presented when taking a step with either the slow or fast leg. The horizontal lines plotted between the two horizontal bars represent the step lengths for when the fast leg is leading (in blue) or for when the slow leg is leading (in red). (C) Leg orientations are illustrated for both legs during slow baseline (1st column), fast baseline (2nd column), and late adaptation (3rd column). Black lines indicate baseline leg orientations at slow (black lines with blue squares) or fast (black lines with red squares) speeds. Leg orientations were similar between speed-specific baseline and late adaptation resulting in asymmetric step lengths in the sloped conditions. (D) The similarity between leg orientations across speed-specific baseline and late adaptation epochs is illustrated by the significant regression (y = a∗x, 95% Confidence interval for a = [0.91, 0.96]). Note that the regression line closely overlaps with the idealized situation in which baseline and late adaptation values are identical (dashed gray line; slope of one, i.e., y = x). (E) Leg orientations are illustrated during early post-adaptation (After-Effects) in the flat group. We also plotted the α and X during medium baseline (black lines with black squares) and during late adaptation (red and blue dotted lines). Note the ipsilateral similarity between the leading leg’s orientation (α) across late adaptation and early post-adaptation contrasting the contralateral similarity between trailing leg’s orientation across these two epochs. (F) The ipsilateral and contralateral similarity between α and X, respectively, across the late adaptation and early post-adaptation epochs is quantified with a signification correlation (y = a∗x, 95% Confidence interval for a = [0.94, 1.03]). The idealized situation in which late adaptation and early post-adaptation values are identical is presented as a reference (dashed gray line; slope of one, i.e., y = x).

