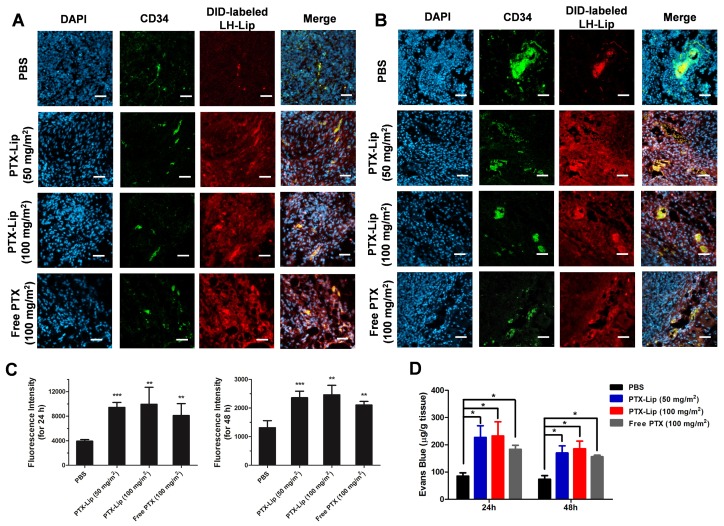
Figure 5.
Penetration of LH-Lip into tumor tissue (A) 24 h or (B) 48 h after pretreatment with different PTX formulations. Blue, green and red represent nuclei, CD34 staining and DID-labeled LH-Lip, respectively. Scale bar, 50 μm. (C) Quantitation of the CLSM images. (D) Evans Blue dye penetration into tumors (n = 3). *P < 0.05, **P < 0.01, *** P <0.005 vs. the PBS group.

