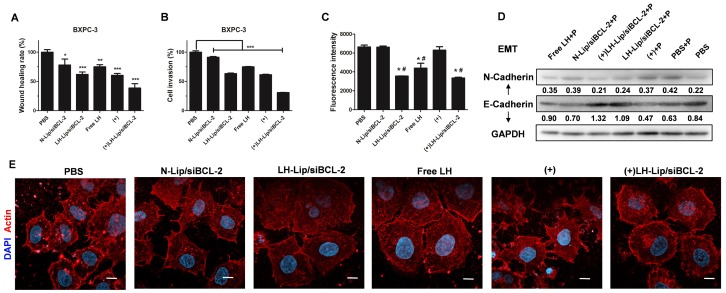
Figure 6.
(A) Wound healing assay and (B) cell invasion assay (n=3). *P < 0.05, **P < 0.01, ***P < 0.005 vs. the PBS group. (C) Effects of different formulations on tumor cell-platelet interactions. *P < 0.005 vs. the PBS group; #P < 0.005 vs. the (+) group. (D) The expression levels of N-Cadherin and E-Cadherin. P: platelets. The numbers shown with the western blots represent the gray value normalized to GAPDH. (E) Actin cytoskeleton of BXPC-3 cells. Scale bar, 10 μm. (+) represents incubation with PTX-Lip (0.3 μg/mL) before treatment.

