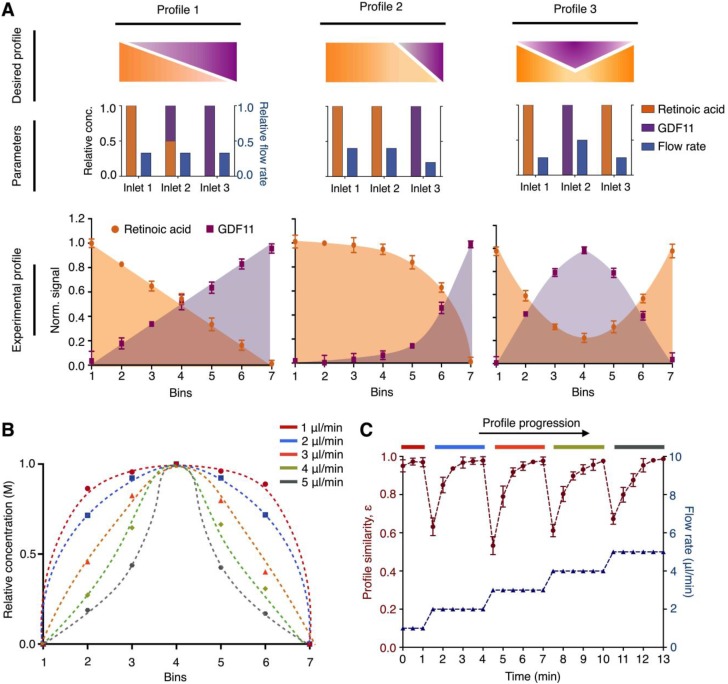
Figure 3.
Versatile and dynamic control of molecular profiles. (A) Generation of simultaneous molecular profiles with retinoic acid and GDF11. We designed representative molecular profiles of the growth factors (top). By varying multiple empirical parameters including the positions, concentrations and flow rates of the growth factors at the respective inlets (middle), we generated and quantified corresponding experimental molecular profiles on the microHIVE platform (bottom). To measure the exact concentrations of the experimental profiles, we sectioned the culture chamber laterally into seven equal bins and quantified the concentrations of the eluted growth factors from each bin through spectrometric measurements. (B) Different molecular profiles with flow rate changes. To investigate the effects of flow rates in dynamically changing the shape of the molecular profile, we simulated a series of steady-state parabolic profiles of retinoic acid, by increasing the flow rates from 1 μl/min to 5 μl/min. (C) Dynamic response of the microHIVE platform. We empirically implemented these simulated parabolic molecular profiles on the microHIVE platform, by varying the flow rates accordingly, and monitored the changes in the experimental profile continuously. To quantitatively compare the experimental profile (under different flow rate regime) to their respective steady-state profile, we defined a profile similarity metric ε, based on the sum of the squares of the concentration offset at different spatial locations (see Methods for additional details). Note that the microHIVE platform not only generated accurate molecular profiles, but also showed a rapid response to equilibrate to steady-state. All experimental measurements were performed in triplicate, and the data are displayed as mean ± s.d in A and C.

