Figure 2.
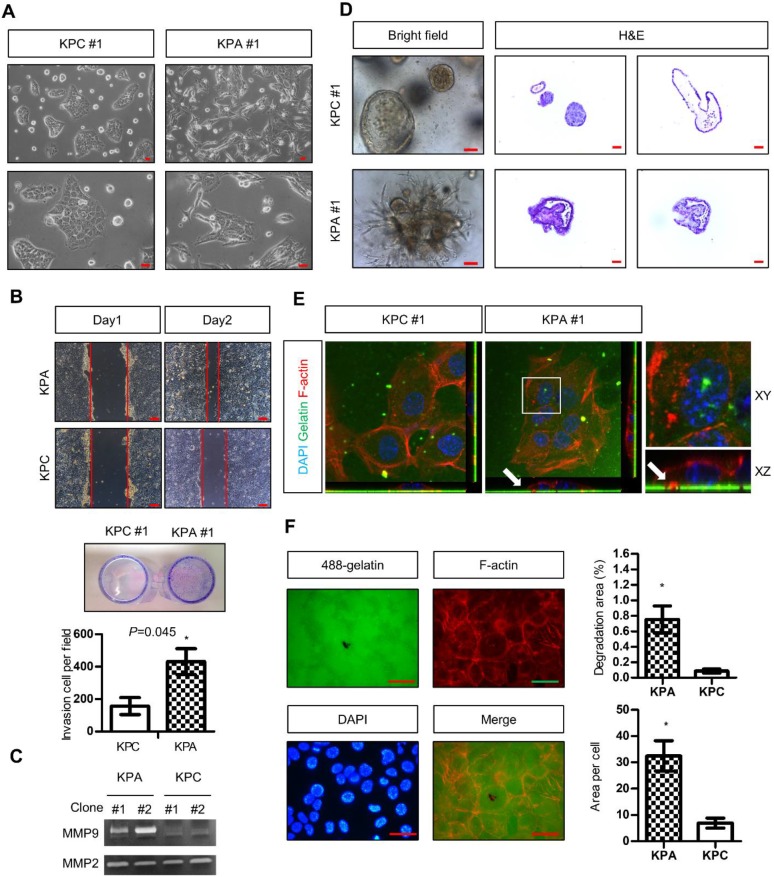
The KPA cancer cells are highly invasive and tumorigenic. (A) Morphology of the KPA and KPC cancer cells, observed under a light microscope. Scale bars represent 50 μm. (B)The migration and invasion of the KPC and KPA cancer cells were assessed by wound healing (left panel) and transwell (right panel) assays. The data represent mean ± SEM (n=3). *p<0.05. Scale bars represent 100 μm. (C) Morphology of the organoids established from the KPC and KPA cancer cells. Scale bars represent 75 μm. The organoids were processed for cryosection and H&E staining. Scale bars represent 50 μm. (D) Activity of MMP-2 and MMP-9 in the conditioned medium of two independent cancer cell clones isolated from different KPC and KPA tumors was assessed by gelatin zymography. (E) Confocal microscope images showing the result of the matrix digestion assay; the white arrow indicates the co-localization of F-actin-positive cell protrusion and gelatin digested area (without fluorescence). The z stack images were obtained and reconstituted by confocal microscopy. The XY and XZ sections of the boxed areas are shown. (F) The total digested area and the digested area per cell of Alexa Fluor 488-conjugated gelatin by the KPC and KPA cancer cells are shown. The experiments were repeated three times and the data represents mean ± SEM (n=3). *p<0.05. Scale bars represent 20 μm.

