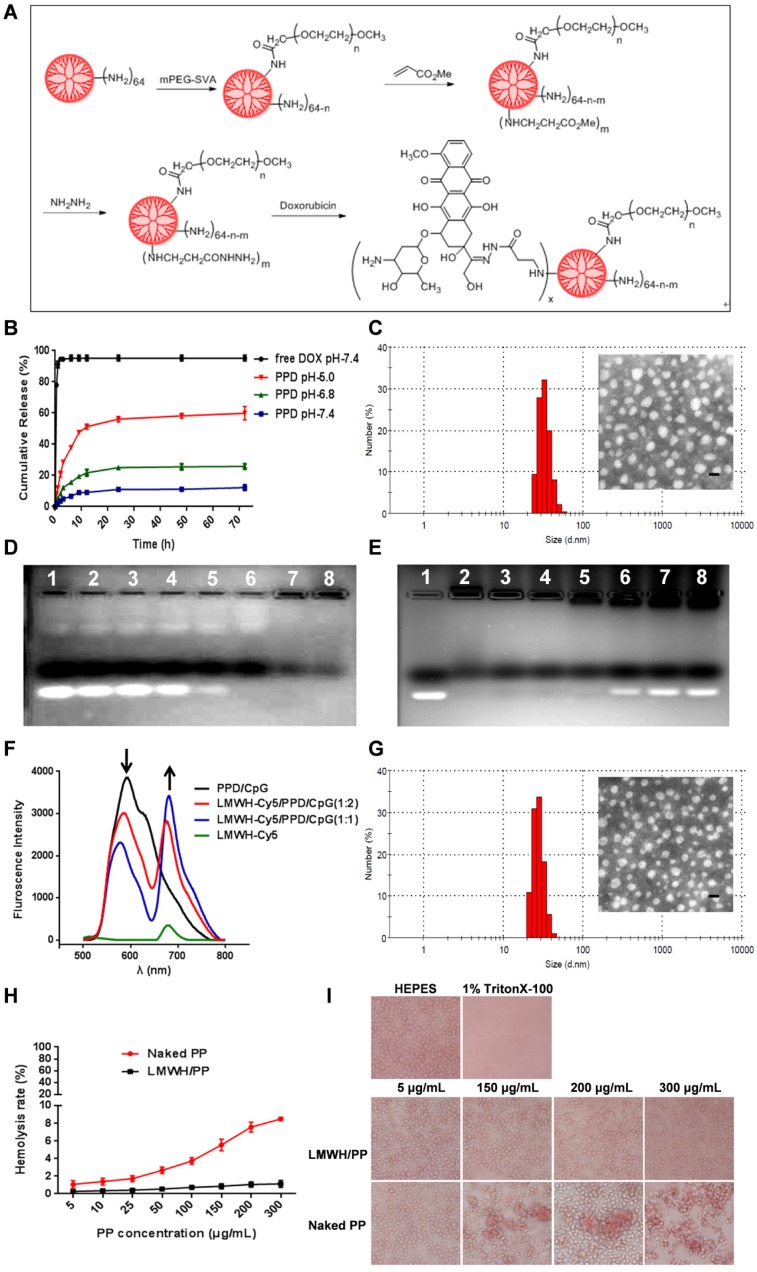
Figure 2.
(A) Schematic illustration of reaction scheme for the synthesis of PPD conjugates. (B) Cumulative released DOX from PPD in pH 7.4, 6.8 and 5.0 at different time points. (C) DLS and TEM image of PPD, The scale bar represents 50 nm. (D) CpG ODNs condensation ability of PPD. Lane 1 represents naked CpG ODNs. The mass ratios of PPD to CpG ODNs in lane 2-7 are: 0.2: 1, 0.5: 1, 1: 1, 2: 1, 4: 1, 8: 1, 12: 1. (E) Amount of LMWH determined by agarose gel electrophoresis. Group1 represents Naked CpG ODNs and the mass ratios of LMWH to PPD in lane 2-7 are: 0.1: 1, 0.25: 1, 0.4: 1, 0.6: 1, 0.8: 1, 1.0: 1, 1.2: 1. (F) Fluorescence emission spectra of various formulations with Cy5/DOX mass ratios of 0: 2, 1: 2, 1: 1 and 2: 0. (G) DLS and TEM image of LMWH/PPD/CpG. The scale bar represents 50 nm. (H) Hemolysis rate (%) of red blood cells when treated with different concentrations of PP and LMWH/PP. (I) Images of red blood cells when treated with Naked PP and LMWH/PP at various concentrations.

