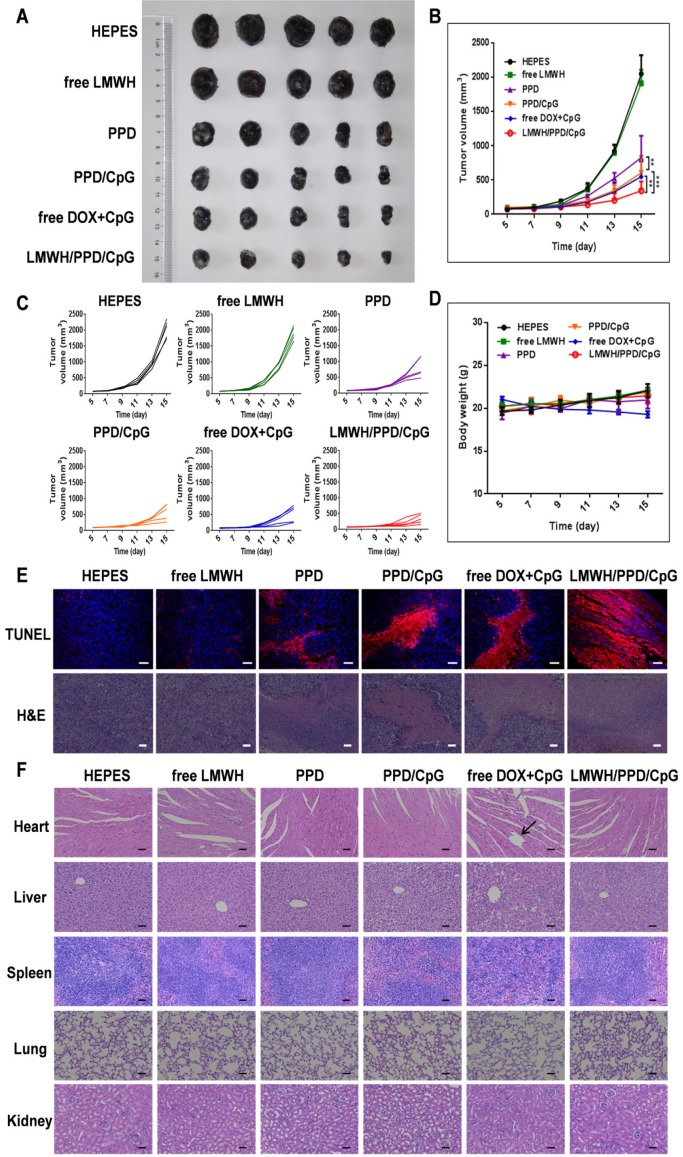
Figure 8.
In vivo anti-tumour efficacy of indicated formulations. (A) Photographs of tumors at the end of treatments. (B) Tumor growth curves of various groups. *p < 0.05, **p < 0.01, ***p < 0.001. (C) Individual tumor growth curves of various groups. (D) Curves of mice weight changes during the treatment process. (E) TUNEL staining and H&E staining of collected tumors. The scale bar represents 50 μm (TUNEL) or 200 μm (H&E). (F) H&E staining of hearts, livers, spleens, lungs and kidneys in various groups. Black arrow indicates the cardiotoxicity. The scale bar indicates 200 μm.

