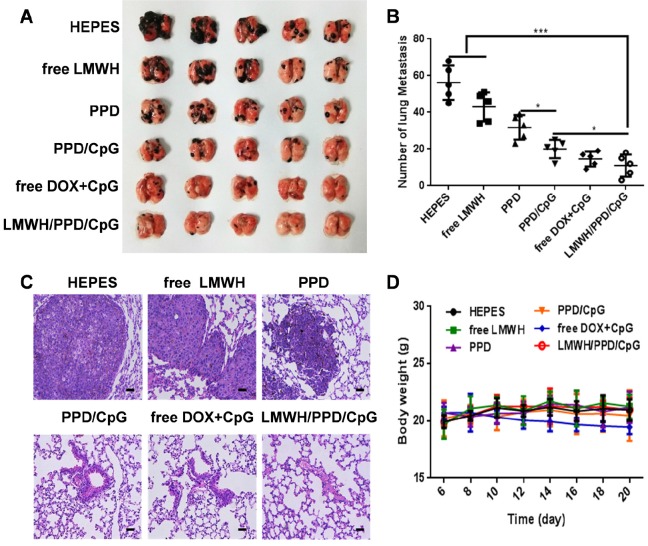
Figure 9.
Anti-metastatic effects of the different formulations. (A) Pictures of lung tissues at the end of treatments. (B) Number of lung metastatic nodules in each group. *p < 0.05, **p < 0.01, ***p < 0.001. (C) Histological analysis of lung sections. The scale bar represents 200 μm. (D) Curves of mice body weight changes during the treatment process.

