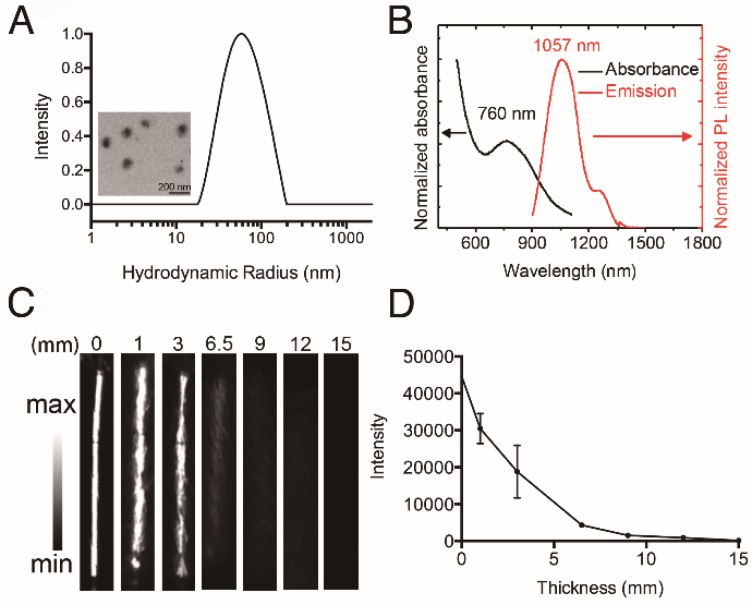
Figure 3.
Characterization of HT@CDDP NPs. (A) The hydrodynamic radius (Rh) of HT@CDDP NPs in PBS determined by dynamic light scattering (DLS) and transmission electron microscopy (TEM) image of HT@CDDP NPs. Scale bars represent 200 nm. (B) The absorption and fluorescence emission spectra of HT@CDDP NPs. (C) NIR-II imaging and (D) signal intensities of HT@CDDP NPs covered by chicken breast tissues with varying thicknesses. The results represent mean ± SE (n=3).

