Figure 4.
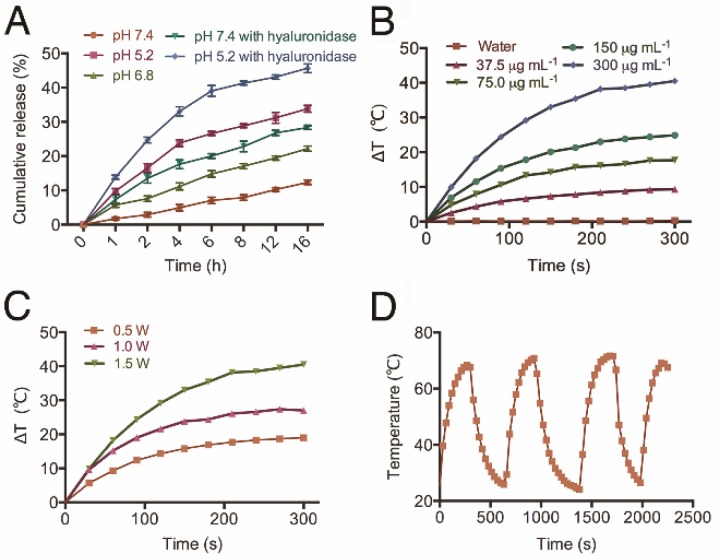
The release profile and photothermal property of NPs. (A) The cumulative drug release profile of HT@CDDP NPs at different pH values and in the case of hyaluronidase. The results represent mean ± SD (n=3). (B) The heating curves of HT@CDDP NPs at different concentrations by an 808-nm laser at a power density of 1.5 W cm-2. (C) The heating curves of HT@CDDP NPs (300 μg mL-1 TQTPA) by an 808-nm laser at different radiant power values. (D) The heating-cooling curve of HT@CDDP NPs (300 μg mL-1 TQTPA) by an 808-nm laser at a power density of 1.5 W cm-2.

