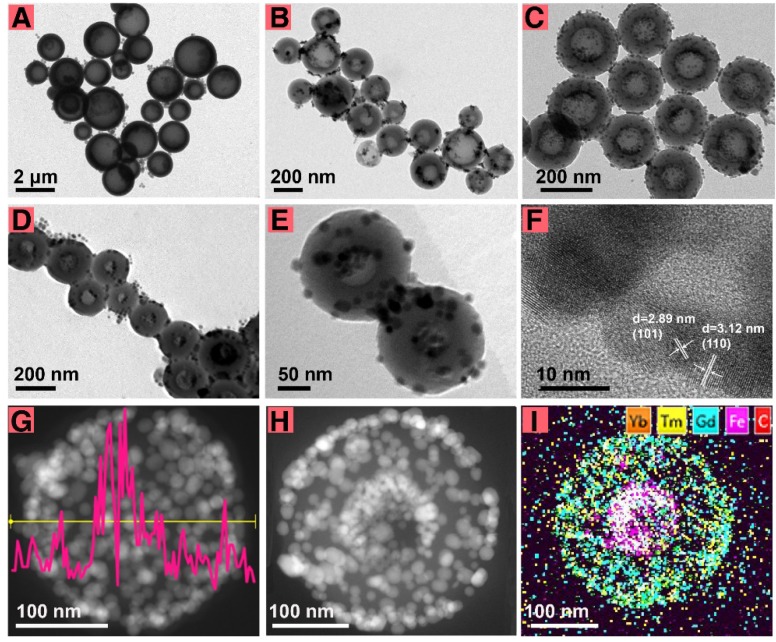
Figure 1.
The morphology and structure characterization. TEM images of FeCU (A-C) with different diameters, (D) FeCU with more amount of loading Fe3O4. (E) TEM image of FeCUPs. (F) HRTEM of FeCU. (G) EDS line scan of Fe element in FeCU, and corresponding STEM-HAADF image. (H) STEM-HAADF image of FeCU and (I) corresponding element mapping of Yb (orange), Tm (yellow), Gd (blue), Fe (magenta), C (red).

