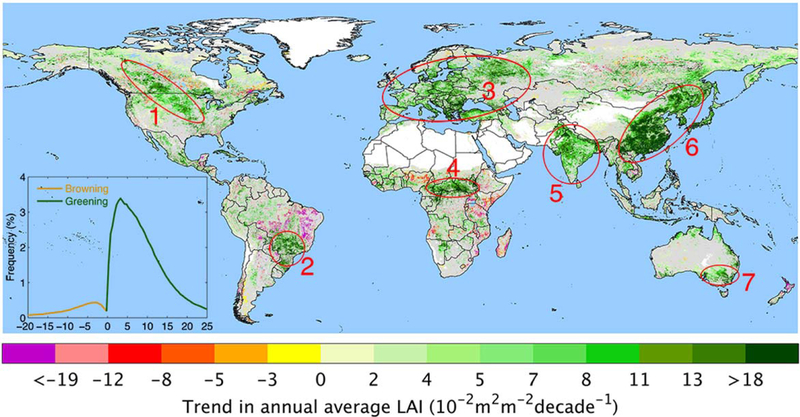
Fig. 1|. Map of trends in annual average MODIS LAI over 2000–2017.
Statistically significant trends (Mann-Kendall test, p ≤ 0.1) are color coded. Grey areas show vegetated land with statistically insignificant trends. White areas depict barren lands, permanent ice-covered areas, permanent wetlands and built-up areas. Blue areas represent water. The inset shows the frequency distribution of statistically significant trends. The highlighted greening areas in red circles overlap with croplands mostly with the exception of circle number 4. Similar patterns are seen at p ≤ 0.05 and the seven greening clusters are dominantly visible even at p ≤ 0.01.

