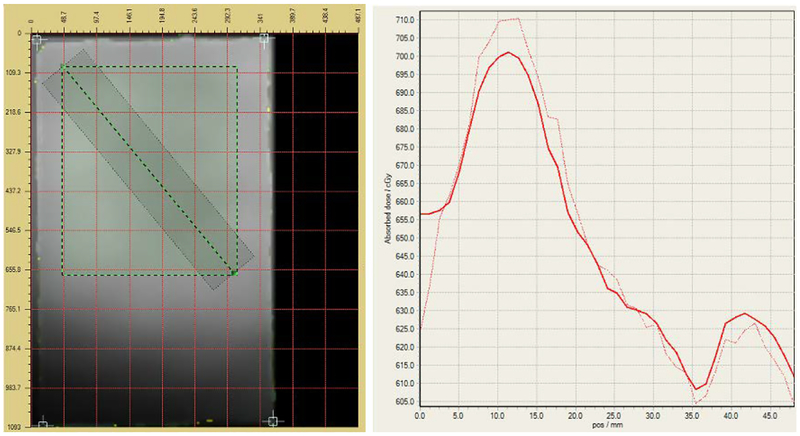
Fig 31.
The planned (solid) and delivered (dashed) dose profiles (right) along a diagonal line from the top left corner to the bottom right corner of the film slice (left). The rectangle (green-black dashed) is the outline of the film section corresponding to the isodose map in Fig. 30.

