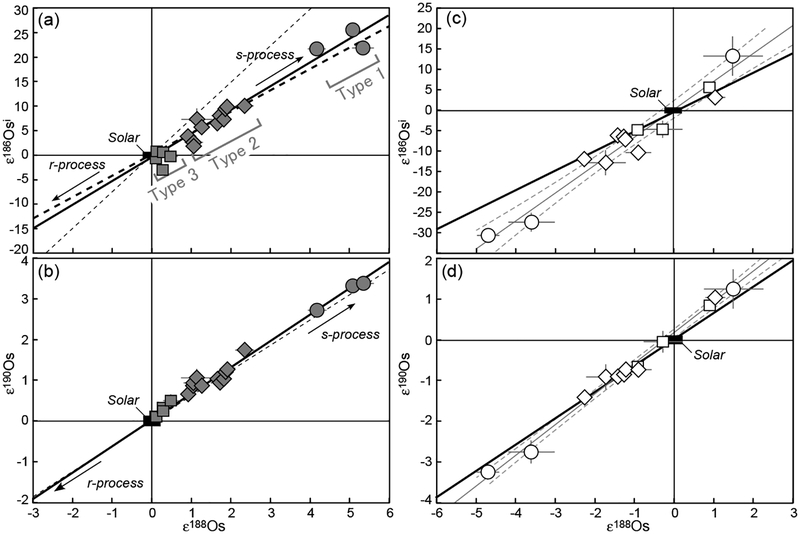
Figure 24.
Osmium isotope anomalies in (a, b) acid residues and (c, d) acid leachates from carbonaceous and ordinary chondrites. Data are from Yokoyama et al. (2010). Error bars are uncertainties of individual measurements (2 SE). Circle, diamond, and square symbols are residues (filled) and leachates (open) from chondrite samples with petrologic types 1, 2, and 3, respectively. Black bold lines represent mixing lines between a solar component and a presumed s-process component, for which the slopes are 4.84 ± 0.34 for (a,c) and 0.647 ± 0.027 for (b,d). Bold and thin dashed lines in (a, b) are mixing trends for the solar and an s-process component calculated by Reisberg et al. (2009) using the Os MACS values in Mosconi et al. (2006) and Bao et al. (2000), respectively. Gray thin lines in (c, d) represent regressions of leachate samples with 2σ error envelope (gray dashed curves).

