FIGURE 2.
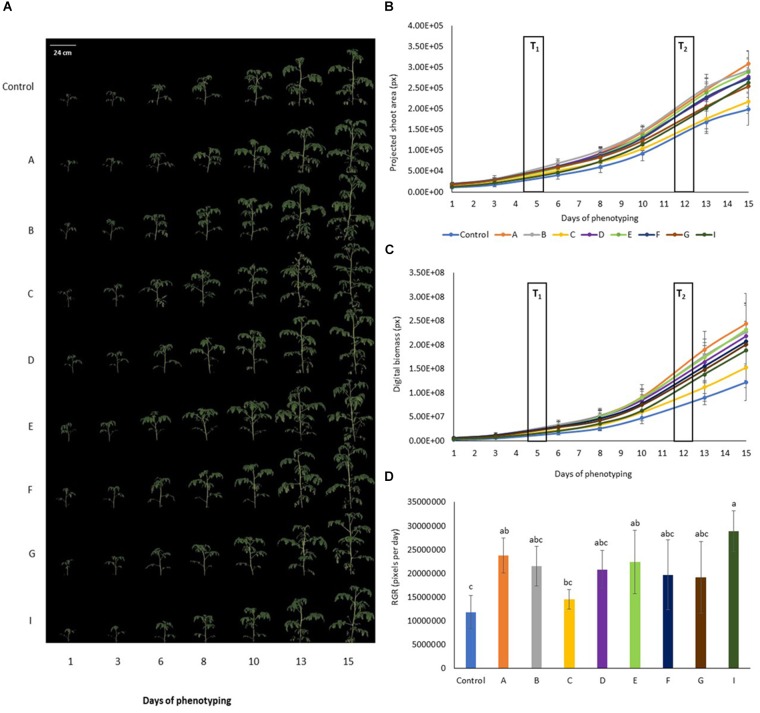
Color segmented side view Red Green Blue (RGB) images of tomato plants prior to and upon PHs application. (A) Side view (120°) RGB image of the tomato plants over the time of phenotyping period (D1–D15). (B) Projected shoot area over time of phenotyping period. Values represent the average of six biological replicates per treatment. Error bars represent standard deviation. T1 and T2 correspond to days of protein hydrolysates application by foliar spraying. (C) Digital biomass quantified over time of phenotyping period. Values represent the average of six biological replicates per treatment. Error bars represent standard deviation. T1 and T2 correspond to days of protein hydrolysate application by foliar spraying. (D) Comparison of relative growth rate for the different treatments quantified over phenotyping period following the protein hydrolysate treatments (DAT 6–DAT 15). Values represent the average of six biological replicates per treatment. Error bars represent standard deviation.

