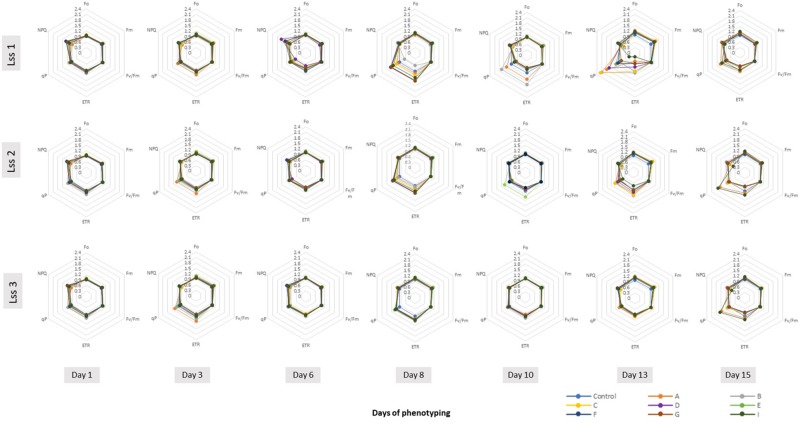
FIGURE 4.
Spider plots of photosynthetic parameters deduced from kinetic chlorophyll fluorescence imaging on whole plant level in all treatments. Minimal fluorescence in dark-adapted state (Fo), maximum fluorescence in dark-adapted state (Fm), maximum quantum yield of PSII photochemistry for the light-adapted state (Fv′/Fm′), the photochemical quenching coefficient that estimates the fraction of open PSII reaction centers (qP), steady-state non-photochemical quenching (NPQ) and electron transport rate (ETR) were measured using the light curve protocol for tomato plants prior to and upon PHs treatments. The data are shown for the protein hydrolysate treated plants after normalization to respective values obtained in the control treatment at various time points of phenotyping period. Data are mean of six independent plants per treatment. Lss1, Lss2 and Lss3 represent actinic photon irradiance measurements taken at 170, 620, and 1070 μmol photons m-2 s-1, respectively.

