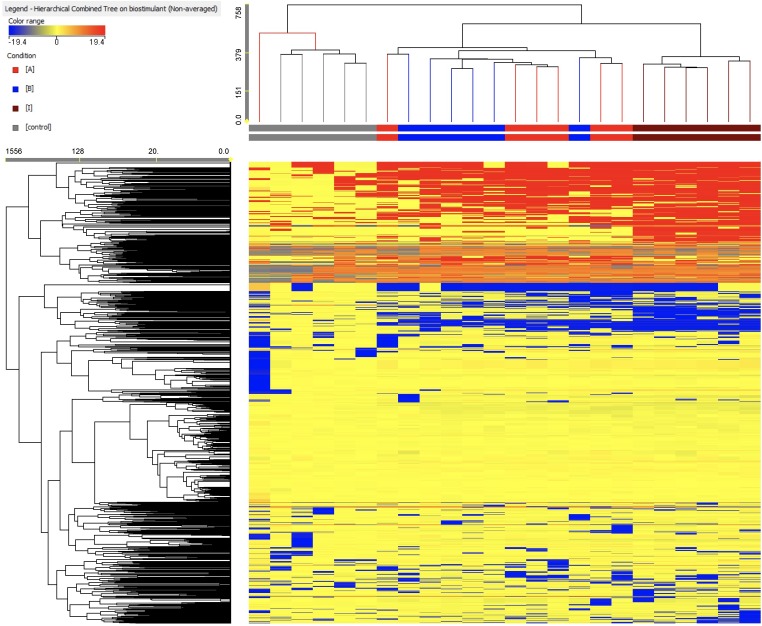
FIGURE 5.
Unsupervised hierarchical cluster analysis carried out from metabolomic profiles following application of selected protein hydrolysates. Dendrograms were produced on the basis of fold-change heat-maps using metabolites profile gained from UHPLC-ESI/QTOF untargeted metabolomic profiling. The Wards’ linkage rule and Euclidean similarity were chosen to produce dendrograms.

