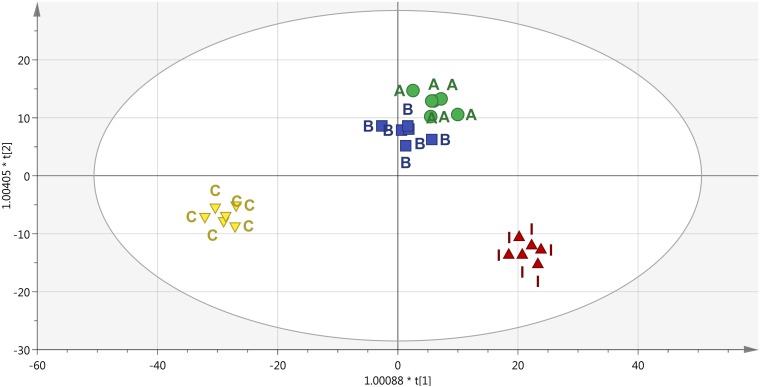
FIGURE 6.
Score plot of Orthogonal Projection to Latent Structures Discriminant Analysis (OPLS-DA) supervised modeling carried out on metabolomic profiles following application of selected protein hydrolysates. The variation between groups was separated into predictive and orthogonal components (i.e., that ascribable to technical and biological variation). The OPLS model was cross-validated using CV-ANOVA (p < 0.01) and permutation tested to exclude over fitting. Furthermore, the presence of outliers was investigated according to Hotelling’s T2 method (i.e., the distance from the origin in the model) using 95 and 99% confidence limits for “suspect” and “strong” outliers, respectively. The pattern observed in the score plot was used to identify discriminant compounds based on Variable of Importance in projection (VIP) analysis.

