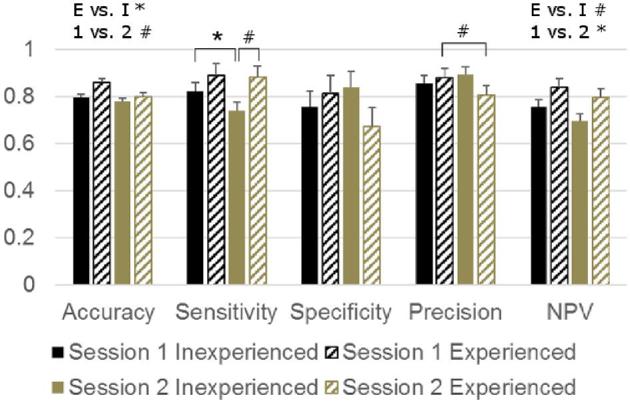
Figure 1.

LSMEANS + SEM of performance statistics for binary keel bone deviation assessment (absent: deviation <0.5 cm, present: deviation >0.5). E vs. I: main effect of experience (E) vs. inexperience (I) prior to the experiment, 1 vs. 2: main effect of session,  : interactive effect, pairs connected by the line (tend to) differ after step-up Bonferroni adjustment (pairs differing in 2 factors not compared). *P < 0.05, # P < 0.10. NPV = negative predictive value.
