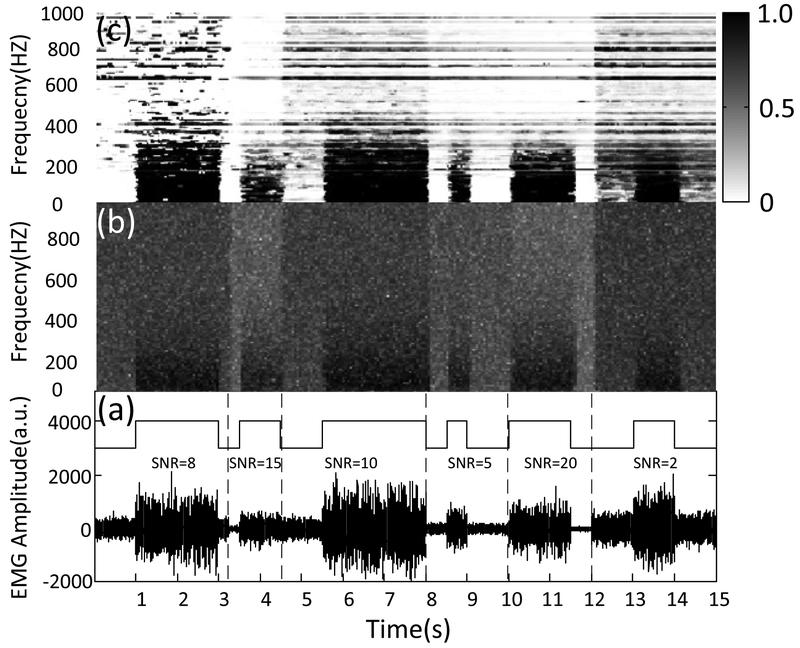
Fig. 3.
Spectrogram illustrating the EBPP estimated by the sequential HMM method. (a) Superimposing the rectangular envelope built on the basis of the onset/offset to the EMG trace with SNRs. (b) The magnitude spectrogram of the EMG data. (c) The EBPPs obtained from the EMG traces. The transition from white to black associated with the EBPPs corresponds to probability changing from 0 to 1. The two-dimensional representation (color map: dark, high values; white, low values) provides the probability of EMG burst presence at each time instant (x-axis) and frequency (y-axis).

