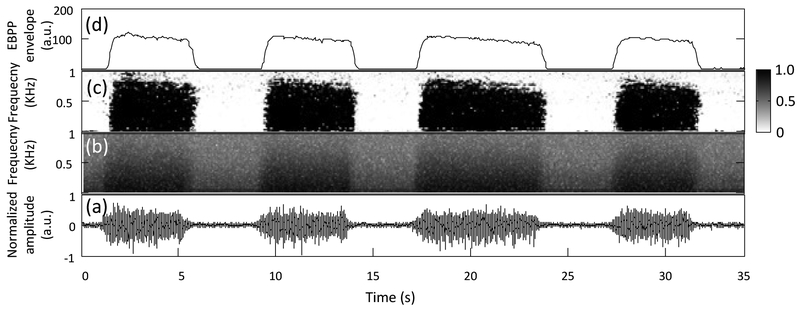
Fig. 5.
An experimental EMG recording and the corresponding signal spectra, the EBPPs and the EBPP envelope. (a) A representative EMG trace consisting of four bursts. (b) The magnitude spectrogram of the EMG data. (c) The EBPPs obtained from the EMG data, the transition from white to black associated with the EBPPs corresponds to probability changing from 0 to 1. (d) The EBPP envelope generated from the sum of the EBPP at each Mel-scale subband.

