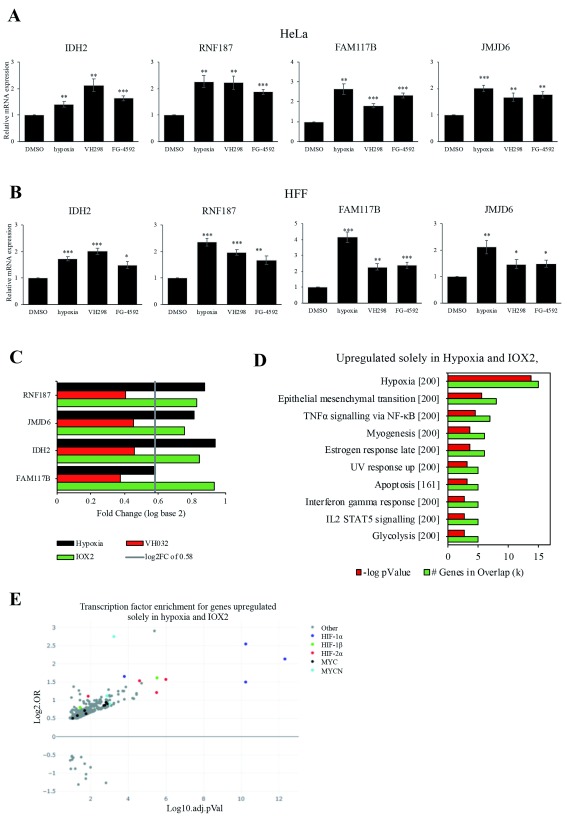
Figure 5. RNA seq validation of genes solely upregulated in hypoxia and IOX2, but not VH032.
( A) HeLa and ( B) HFF cells were treated with 0.05% DMSO (vehicle control), 1% O 2 (hypoxia), 100 µM VH298 and 50 µM FG-4592 for 16 h prior to mRNA extraction. The graphs show relative mRNA transcripts normalised to actin mRNA levels. The mean + SEM were determined from three independent experiments. Two-tailed student t-test analysis was performed * P ≤ 0.05, ** P ≤ 0.01, *** P ≤ 0.001 and ns: P>0.05. ( C) Table showing log2FC according to data obtained from RNA-seq analysis of known HIF target genes in hypoxia and IOX2, but not VH032. ( D) Gene set enrichment analysis (GSEA) MsigDB showing significant enrichment of gene set signatures for genes upregulated in hypoxia and IOX2, but not found in VH032 at 5% false discovery rate (FDR). ( E) Transcription factor enrichment analysis using TFEA.ChIP showing binding site enrichment for genes upregulated in hypoxia and IOX2, but not B032. The graph represents the adjusted p value (-log10 FDR) and the log-odds ratio (Log2.OR) for the association of ChIP datasets.

