
Figure EV4. Tandem‐target dwelltime and single‐target binding rate.
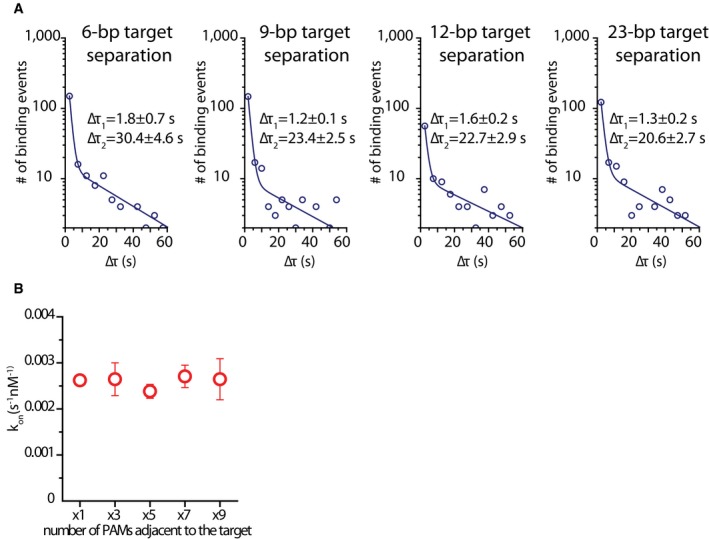
- Dwelltime distributions for tandem‐target construct for each target separation, fitted with a double‐exponential decay function. Equation of the fit: y = A1e−t/τ1 + A2e−t/τ2. A values for each tandem‐target construct: d6 ‐ A1 = 640.3, A2 = 8.0; d9 ‐ A1 = 654.7, A2 = 8.8; d12 ‐ A1 = 144.6, A2 = 6.4; d23 – A1 = 635.3 A2 = 5.6. Average dwelltime for each construct: d6 ‐ τav = 12.3 s; d9 ‐ τav = 6.9 s; d12 ‐ τav = 10.7 s; d23 ‐ τav = 7.6 s. Average dwelltimes were calculated using equation
- Scatter plot showing the total binding rate (kon) for each single‐target, multiple PAM construct. Binding rate stays constant with increasing number of adjacent PAMs. The values are averages of four measurements over 3 days. Error bars represent standard error of the mean. kon was calculated using the equation kon = 1/(CxΔτon) where C is the molarity of DNA target in the channel.