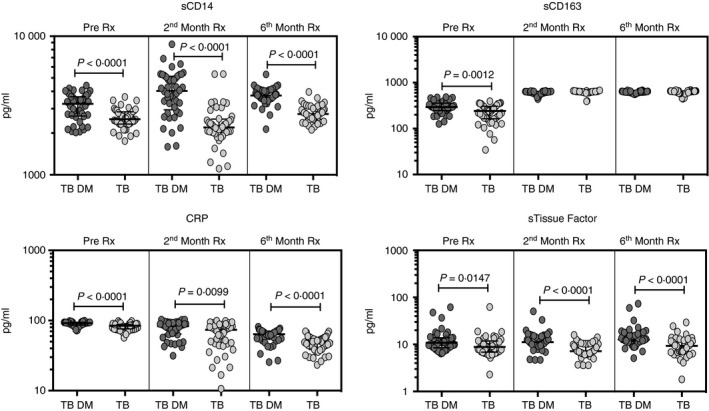
Figure 2.

Tuberculosis–diabetes mellitus co‐morbidity (TB‐DM) is associated with increased frequencies of monocyte activation markers pre‐treatment and following treatment. Circulating levels of monocyte activation markers in TB‐DM (n = 44) and TB (n = 44) individuals at pre‐treatment and at 2 and 6 months following treatment are shown. Data are represented as scatter plots with each circle representing a single individual. P values were calculated using the Mann–Whitney test.
