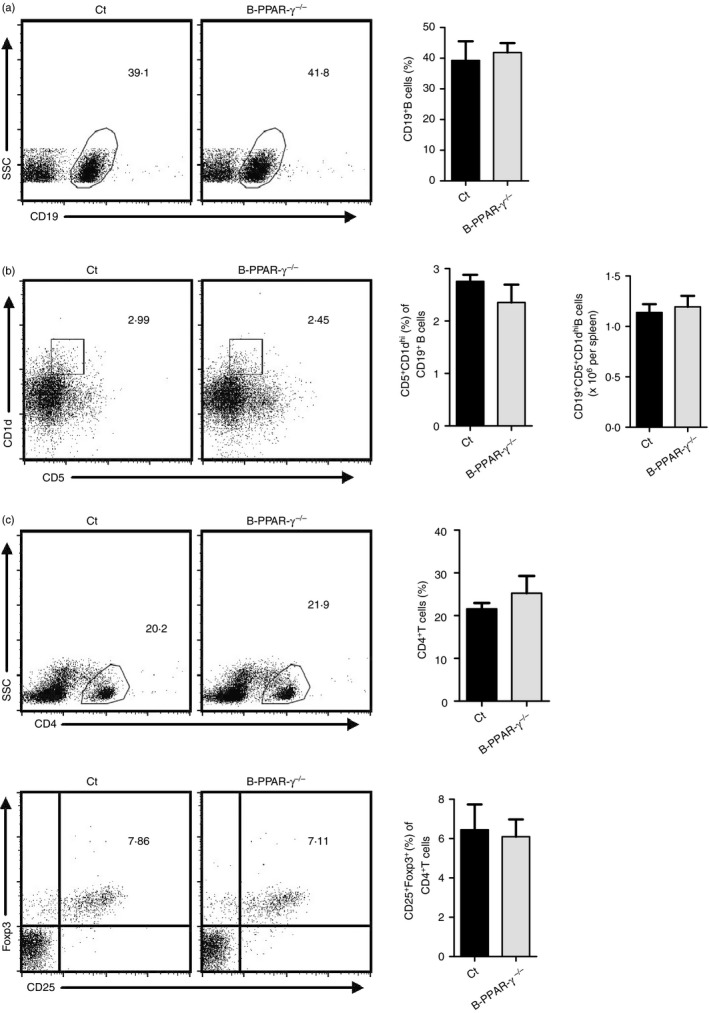
Figure 2.

Naive B‐cell‐specific peroxisome proliferator‐activated receptor γ knockout (B‐PPAR‐γ −/−) mice have normal splenic CD5+ CD1dhi regulatory B (Breg) and peripheral CD4+ CD25+ Foxp3+ regulatory T (Treg) cells. Splenocytes and peripheral blood were collected from naive control mice and B‐PPAR‐γ −/− mice. Representative flow cytometry plots and bar chart show (a) the frequency of CD19+ B cells in splenic lymphocytes. Representative flow cytometry plots are gated for lymphocytes. (b) The frequency of CD5+ CD1dhi Breg cells in CD19+ B cells and the number of CD5+ CD1dhi Breg cells in spleen. Representative flow cytometry plots are gated for CD19+ cells. (c) CD25+ Foxp3+ Treg cells among the total CD4+ T cells in peripheral blood were analyzed. Representative flow cytometry plots are gated for lymphocytes or CD4+ cells. Bar graphs indicate mean (± SEM), n = 3, similar results were obtained from two independent experiments.
