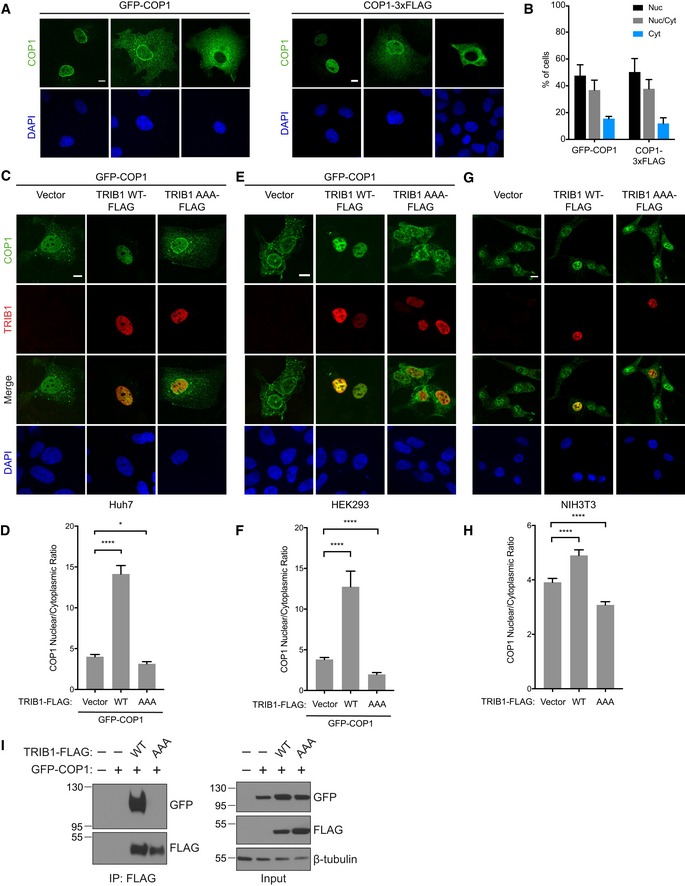
Figure EV1. TRIB1 promotes nuclear localization of COP1.

-
ARepresentative immunofluorescence images of COS7 cells expressing GFP‐COP1 or COP1‐3xFLAG showing the different patterns of localization (nuclear, nuclear and cytoplasmic, and cytoplasmic) typically observed within a cell population. For visualizing COP1‐3xFLAG, the cells were stained with anti‐FLAG (Sigma) and anti‐mouse Alexa Fluor 568. Nuclei were counterstained with DAPI (blue). Scale bar, 10 μm.
-
BQuantification of percentage of cells observed in (A) with the indicated COP1 construct exhibiting nuclear (Nuc), nuclear and cytoplasmic (Nuc/Cyt), or cytoplasmic (Cyt) localization. Mean values ± s.e.m. are shown for three independent experiments where 50 individual cells per experiment were analyzed.
-
C–FRepresentative images of Huh7 cells (C) and HEK293 cells (E) expressing GFP‐COP1 (green) co‐transfected with empty vector or the indicated TRIB1‐FLAG construct (red). Cells were stained with anti‐FLAG (Sigma) and anti‐mouse Alexa Fluor 568. Nuclei were counterstained with DAPI (blue). Scale bar, 10 μm. See also Appendix Fig S1C and D for Western blots showing the expression levels of the constructs used. (D, F) Quantification of the average ratio of nuclear/cytoplasmic fluorescence of GFP‐COP1 in (C) and (E). Mean values ± s.e.m. are shown for three independent experiments where 50 individual cells per experiment were analyzed. Significance relative to GFP‐COP1 with empty vector was calculated using the Student's t‐test (*P < 0.01, ****P < 0.00001).
-
G, HRepresentative images of NIH3T3 cells (G) transfected with empty vector or the indicated TRIB1‐FLAG construct (red). Cells were stained with anti‐FLAG (Cell Signaling), anti‐COP1 (Abcam), anti‐mouse Alexa Fluor 647, and anti‐rabbit Alexa Fluor 488. Nuclei were counterstained with DAPI (blue). Scale bar, 10 μm. See also Appendix Fig S1E for Western blots showing the expression levels of the constructs used. (H) Quantification of the average ratio of nuclear/cytoplasmic fluorescence of endogenous COP1 in (G). Mean values ± s.e.m. are shown for three independent experiments where 50 individual cells per experiment were analyzed. Significance relative to the empty vector control was calculated using the Student's t‐test (****P < 0.00001).
-
ICoimmunoprecipitation of GFP‐COP1 with TRIB1‐FLAG in COS7 cells showing that the AAA mutation ablates the TRIB1/COP1 interaction.
