
Figure 3. Modeling lung cancer using airway organoids.
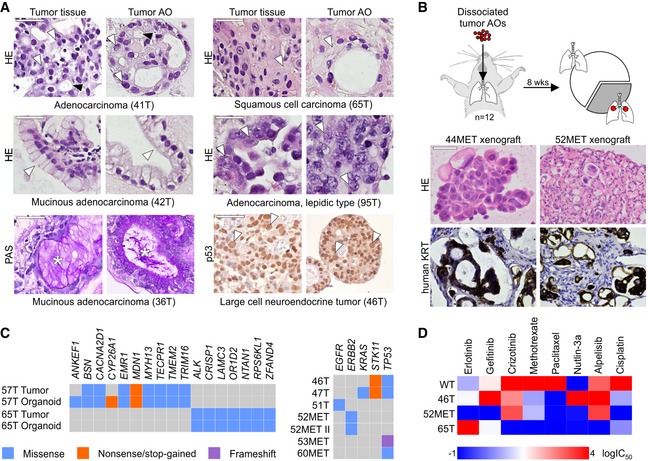
- Tumor AOs derived from different resected primary lung cancer types recapitulate their respective histopathological features. Examples include adenocarcinoma (41T, white arrowheads: multiple nucleoli, black arrowheads: tubule formation), mucinous adenocarcinoma (42T/36T, arrowheads: mucinous glands, stars: PAS‐positive mucus), adenocarcinoma lepidic type (previously known as broncho‐alveolar carcinoma, 95T, arrowheads: distinct large nuclei), squamous cell carcinoma (65T, arrowheads: multi‐layered, keratinization), and large cell neuroendocrine tumor (46T, arrowheads: large nuclei, p53 immunolabeling). Scale bars equal 50 μm.
- Tumor AOs derived from metastatic adenocarcinomas give rise to lung cancer in vivo following intratracheal instillation into immunocompromised mice. 30% of injected mice (n = 12) developed visible tumors 8 weeks after instillation. Tumors show features of adenocarcinomas (HE stainings) and are integrated within murine stroma (human keratin immunolabeling). Scale bars equal 50 μm.
- WGS reveals largely conserved mutation status of lung cancer genes between matched tumor–organoid pairs (left plot, Appendix Table S1). The right plot shows mutation status of selected lung cancer genes in several additional tumor AO lines derived from primary as well as metastatic lung cancer. Of note, ERBB2 mutation frequencies in 52MET and 52MET II tumor AOs were almost identical (67 and 70%) despite originating from independent biopsies taken 3 months apart. See Appendix Table S2.
- Heat map of IC50 values of selected anti‐cancer drugs indicating differential responses of tumor AOs. For example, 46T (mutant TP53) is resistant to Nutlin‐3a treatment, 65T (mutant ALK1) is resistant to treatment with crizotinib, and 52MET (mutant ERBB2) is sensitive to treatment with erlotinib and gefitinib. See Appendix Fig S4F for individual dose–response curves.