
Figure 1. Autophagy is impaired in Becn1 +/− microglia.
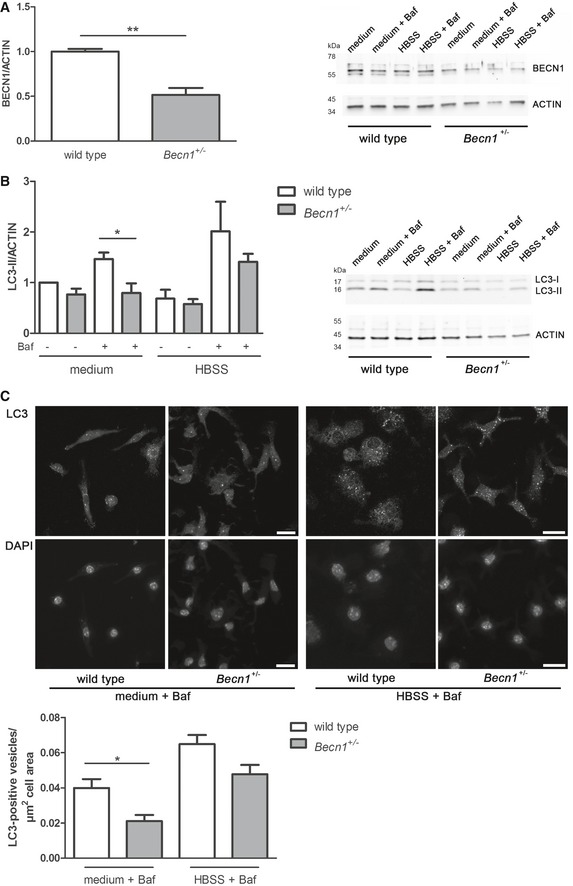
- BECN1 expression of microglia from Becn1 +/− and wild‐type mouse pups in full medium without Bafilomycin A1 (Baf) was quantified by Western blotting. Microglia from Becn1 +/− mice show a significant reduction in BECN1 (48%) compared to microglia from wild‐type mice; mean ± SEM, wild‐type n = 3, Becn1 +/− n = 7; two‐tailed t‐test **P < 0.01. Blot shows representative amounts of BECN1 after various treatments.
- Microglia from newborn Becn1 +/− and wild‐type mouse pups were kept for 2 h either in full medium or in HBSS with or without Bafilomycin A1 (Baf). LC3 and ACTIN levels were determined by Western blot. LC3‐II was significantly reduced in microglia from Becn1 +/− mice after Baf treatment in full medium compared to wild‐type microglia; mean ± SEM, wild‐type n = 3, Becn1 +/− n = 4; two‐tailed t‐test *P < 0.05.
- Microglia from newborn Becn1 +/− and wild‐type mouse pups were kept for 2 h either in full medium or HBSS with Bafilomycin A1 (Baf) and stained for endogenous LC3. Exemplary images and the quantification of LC3‐positive vesicles/μm2 cell area show reduced presence of LC3‐positive vesicles in microglia from Becn1 +/− mice and induction of autophagy by HBSS; mean ± SEM, wild‐type n = 4, Becn1 +/− n = 4, 3–5 fields per view/n and condition and 73–271 cells/n and condition; two‐tailed t‐test *P < 0.05; scale bar: 20 μm.
Source data are available online for this figure.