
Figure 4. NLRP3 and LC3‐positive vesicles are closely associated.
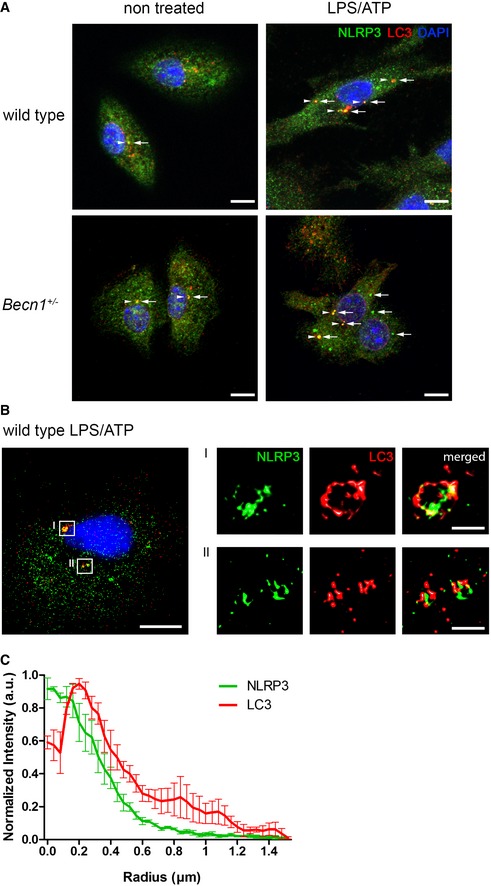
- LPS/ATP‐treated and non treated wild‐type and Becn1 +/− microglia were immunolabeled for NLRP3 (green) and LC3 (red) and imaged by confocal microscopy. Stimulation resulted in the appearance of many NLRP3‐containing aggregates of different sizes (arrows). In non treated cells, only a few overlapping signals with LC3‐stained autophagosomes (arrowheads) are visible. Stimulated microglia, however, showed multiple colocalizations of LC3‐positive vesicles and NLRP3 aggregates; scale bar: 7.5 μm.
- LPS/ATP‐treated wild‐type microglia were immunolabeled for NLRP3 (green) and LC3 (red) and analyzed by super‐resolation microscopy (SIM). NLRP3 aggregates of different sizes coclustering with LC3‐positive autophagosomes are clearly visible. 3D volume rendering of large (I) and small (II) NLRP3 aggregates from the magnified ROIs showed engulfment of NLRP3 by autophagosomes; scale bar: 10 μm; magnified ROIs: 1 μm.
- 3D radial intensity profiles of NLRP3 and LC3 signals derived from SIM images in wild‐type microglia, centered on the maxima of NLRP3 clusters. The radial profiles confirm that both proteins colocalize to the same organelle; mean ± SEM, n = 4.