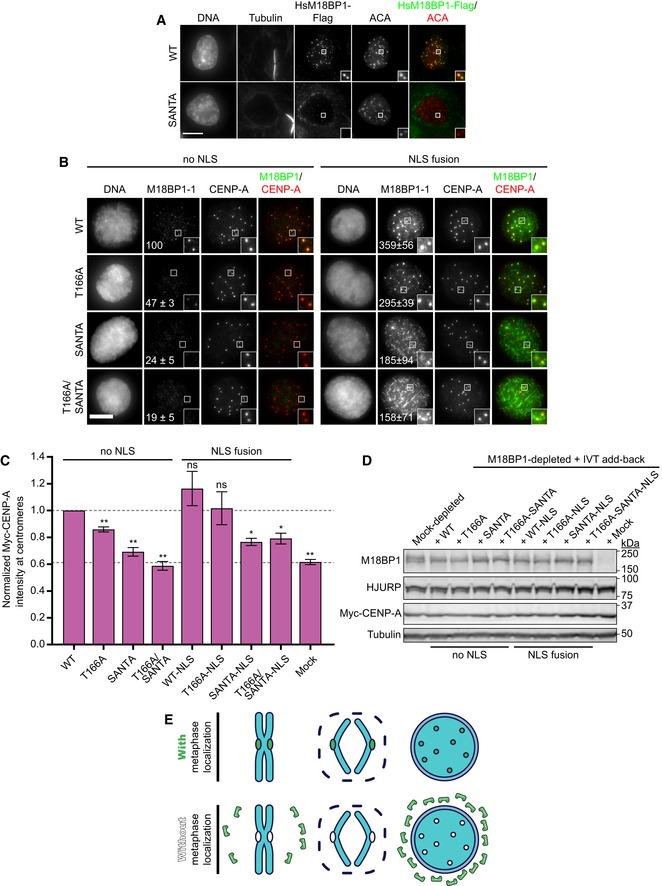
Representative images showing G1 localization of human M18BP1WT or human M18BP1SANTA in sfGFP‐AID‐M18BP1 DLD1 cells treated with 1 mM IAA for 24 h to remove endogenous M18BP1. Centromeric localization is indicated by localization with ACA (α‐centromere autoantibody serum); early G1 cell cycle state is indicated by midbody staining in the tubulin channel. M18BP1 species indicated at left; immunolocalized protein indicated above. Scale bar, 10 μm. Insets are magnified 3×.
Representative immunofluorescence images showing localization of full‐length Flag‐M18BP1‐1 (mutant species indicated at left) without (left panels) and with (right panels) fusion to an SV40 NLS to sperm centromeres in interphase extract depleted of endogenous M18BP1. Immunolocalized protein indicated above. Scale bar, 10 μm. Insets are magnified 3×. Quantification of immunofluorescence intensity at centromeres as total integrated fluorescence signal normalized to wild‐type levels. The values shown on each panel are represented as a percentage of wild‐type Flag‐M18BP1‐1 ± SEM from three independent experiments.
Quantification of Myc‐CENP‐A assembly in M18BP1‐depleted extract complemented with the indicated M18BP1‐1 species. Graph shows mean immunofluorescence intensity at centromeres normalized to reactions complemented with WT M18BP1‐1. Error bars show SEM of at least three independent experiments. Significance determined by Welch's unpaired two‐tailed t‐test, *P < 0.05, **P < 0.005.
Representative Western blot of CENP‐A assembly reactions in (B). Efficient M18BP1 depletion is indicated by comparing lanes 1 and 10. Add‐back of wild‐type or mutant M18BP1‐1 is near endogenous levels.
Model showing that metaphase localization of M18BP1 (green) promotes M18BP1 retention on chromosomes during nuclear envelope formation to promote centromeric localization during interphase.