Figure 6.
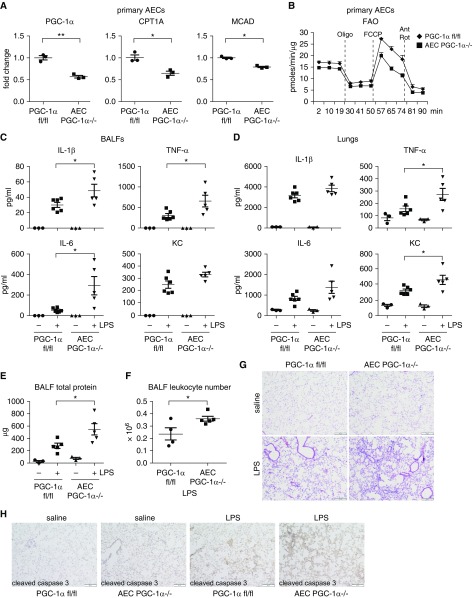
Ablation of AEC PGC-1α aggravates LPS-induced ALI. (A) AECs were purified from the control PGC-1αfl/fl and AEC PGC-1α−/− mice and levels of the indicated genes determined. n = 3; mean ± SEM; *P < 0.05, **P < 0.01. (B) Mice were treated with tamoxifen as in A. AECs were purified, seeded in Seahorse microplates in FAO assay media supplemented with 150 μM palmitate-BSA and cultured for 1 hour, followed by sequential treatments with 3 μg/ml oligomycin, 6 μM FCCP, and 1 μM Rot and 0.5 μM Ant. Real-time OCR was recorded. n = 2 per group. (C and D) The control PGC-1αfl/fl and AEC PGC-1α−/− mice were instilled intratracheally with saline or LPS (2 mg/kg in 50 μl saline). At 24 hours after treatment, the mice were killed and BALF (0.5 ml for 3 times/mouse) and lungs collected. BALF was centrifuged to collect supernatants and cell pellets. Red blood cells in the cell pellets were lysed. The whole lungs were homogenized in 3-ml protein extraction buffer. Levels of indicated proinflammatory cytokines in BALF (C) and lung extracts (D) were determined by ELISA. (E and F) Total protein levels (E) and leukocyte numbers (F) in the BALFs. *P < 0.05. (G) Lungs of experiments similar to C were fixed with 10% neutral-buffered formalin and tissue slides prepared. Hematoxylin and eosin staining was performed. (H) Lungs of experiments similar to C were fixed and tissue slides prepared. Immunohistochemistry (IHC) assays for cleaved caspase 3 were performed. Rabbit IgG was used as IHC negative control. (G and H) Original magnification ×100; scale bars: 200 μm.

