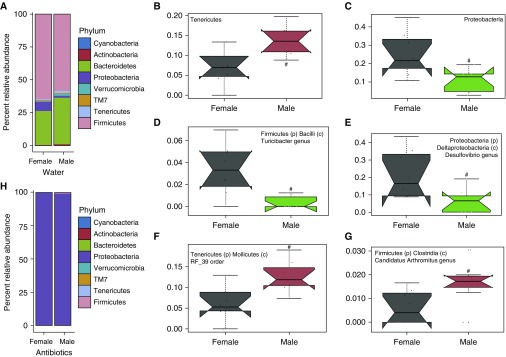
Figure 3.
Sex differences in the microbiome. (A) Relative abundance of bacteria at the phylum level in feces from water-treated male and female mice. (B–G) Relative abundance of (B) Tenericutes and (C) Proteobacteria phyla, and (D) Turicibacter, (E) Desulfovibrio, (F) RF_39, and (G) Candidatus Arthromitus subphyla as assessed by multivariate association with linear models (MaAsLin) (35). (H) Relative abundance of bacterial phyla in antibiotic-treated male and female mice. Sequence reads were assigned to each phylum at 97% sequence similarity cutoff. The trapezoid boxes indicate the 25th and 75th percentiles. The whiskers indicate the minimum and maximum values, and each dot denotes one mouse. The Tukey’s notches on either side of the median line indicate within-sample variance. Red means higher abundance compared with females, and green means lower relative abundance compared with females. n = 7–8 per group; #q < 0.25 as significant.

