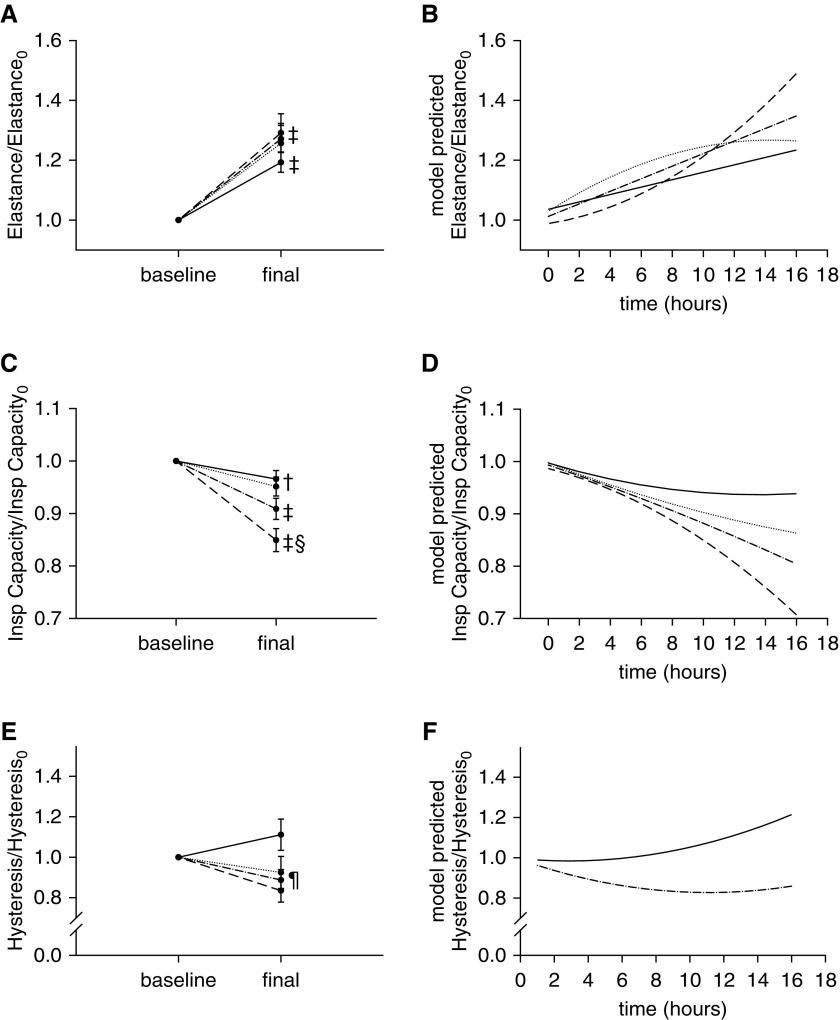
Figure 2.
(A) Elastance increased significantly in all groups from the beginning (Elastance0) to the end of the study (‡P < 0.001 vs. baseline). (B) The longitudinal model indicated a faster rise of elastance in the injurious subgroups (P < 0.001 for interaction between time and group), with the inj-20 subgroup showing a marked increase after 8 hours of mechanical ventilation. (C) Inspiratory (Insp) capacity decreased in all groups (‡P < 0.001 and †P < 0.05 vs. baseline), and the relative magnitude of this decrease was significantly larger in the inj-20 subgroup (§P < 0.001 vs. protective and inj-15). †Refers to both protective and inj-15 subgroups. (D) The longitudinal model indicated a progressively faster rate of decline of inspiratory capacity with increasing Vt (P < 0.001). (E) Final hysteresis normalized by its initial value (hysteresis0) was significantly lower in the injurious than in the protective group (¶P < 0.01). (F) Whereas hysteresis increased progressively in the protective group, it decreased until approximately 11 hours of ventilation in the injurious group and then started to increase (P < 0.05 for interaction between time and group). The longitudinal model did not detect significant differences in the time course of hysteresis between the two injurious subgroups. Solid line = protective group (Vt, 6 ml/kg; RR, 180/min; n = 10); dotted line = inj-15 subgroup (Vt, 15 ml/kg; RR, 80/min; n = 7); dashed line = inj-20 subgroup (Vt, 20 ml/kg; RR, 52/min; n = 5); dashed-dotted line = inj-15 and inj-20 subgroups pooled. Data are mean ± SEM.

