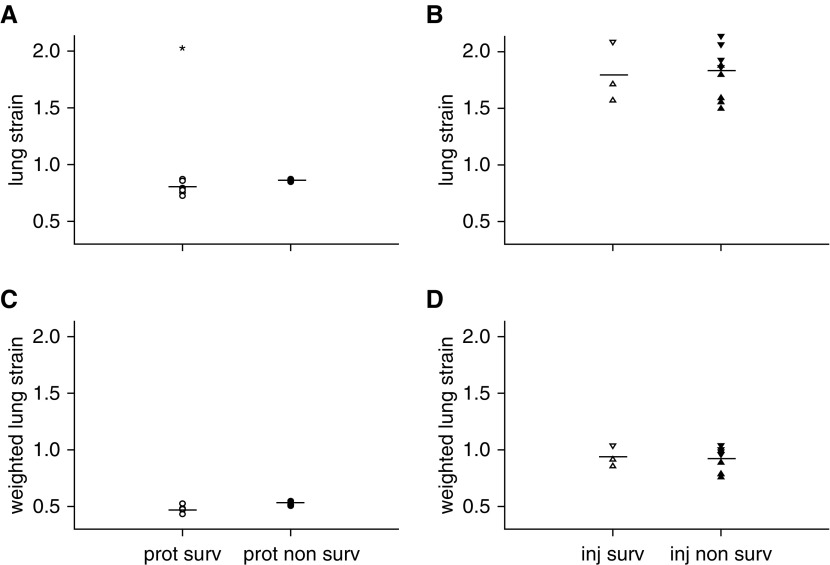
Figure 6.
Lung strain in (A) protective and (B) injurious groups at the beginning of the study. Lung strain weighted by the inspiratory-to-expiratory time ratio in (C) protective and (D) injurious groups. *P < 0.05 survivors versus nonsurvivors. Open symbols = survivors (surv); solid symbols = nonsurvivors; circles = prot group (Vt, 6 ml/kg; RR, 180/min; n = 10); triangles = inj-15 subgroup (Vt, 15 ml/kg; RR, 80/min; n = 7); inverted triangles = inj-20 subgroup (Vt, 20 ml/kg; RR, 52/min; n = 5); lines = mean.

