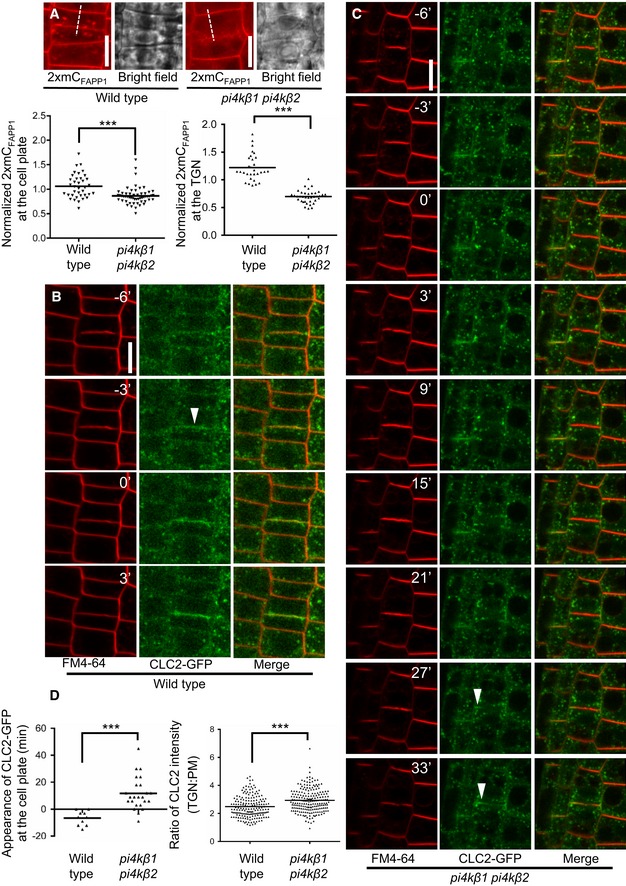
Figure 4. Delayed recruitment of clathrin to the cell plate in the Arabidopsis pi4kβ1 pi4kβ2 double mutant.

-
ATop: Cell plate‐associated fluorescence of the PtdIns(4)P reporter, 2×mCherryFAPP1‐PH, was monitored at the end of cytokinesis in 5‐day‐old wild‐type controls or pi4kβ1 pi4kβ2 double mutants, as indicated. Scale bars, 10 μm. Bottom: The intensity of 2×mCherryFAPP1‐PH signals was quantified at the end of cytokinesis at the cell plate (left plot) and at the TGN (right plot). Signal intensities at the cell plate were recorded along the dashed lines indicated in the images and normalized to intensities at the apical plasma membrane (wild type, n = 37 cells, 24 roots; pi4kβ1 pi4kβ2, n = 55 cells, 41 roots). TGN intensities were recorded using the Airyscan VP mode, and the mean TGN intensity was normalized to mean apical and basal plasma membrane intensity (wild type, n = 30 cells, 22 roots; pi4kβ1 pi4kβ2, n = 37 cells, 31 roots). ***, significant differences (P < 0.0001) according to two‐tailed Mann–Whitney U‐tests.
-
B, CImage series from live‐cell time‐lapse analysis of CLC2‐GFP at the cell plate in roots of wild‐type or pi4kβ1 pi4kβ2 seedlings costained with FM 4‐64, as indicated. Arrowheads, appearance of CLC2‐GFP at the cell plate. Times are given relative to the instance when the cell plate contacted the peripheral plasma membrane, defined as t0. Scale bars, 10 μm. Images are from median focal planes chosen from time‐lapse series recorded as 3D stacks. 3D projections of the t0 images for wild type and double mutant and results for CLC2‐recruitment based on immunostaining can be seen in Appendix Fig S6.
-
DLeft, quantification of the time of CLC2‐GFP appearance at the cell plate in wild type (B) or the pi4kβ1 pi4kβ2 double mutant (C) (wild type, n = 10 cells, 7 roots; pi4kβ1 pi4kβ2, n = 24 cells, 19 roots). Right, quantification of CLC2‐GFP at the TGN in interphase cells. Five‐day‐old roots expressing CLC2‐GFP were subjected to immunostaining, and the mean TGN intensity was normalized to plasma membrane intensity (wild type, n = 14 cells, 2 roots; pi4kβ1 pi4kβ2, n = 15 cells, 2 roots). ***, a significant difference (P < 0.0001) according to a two‐tailed Student's t‐test.
