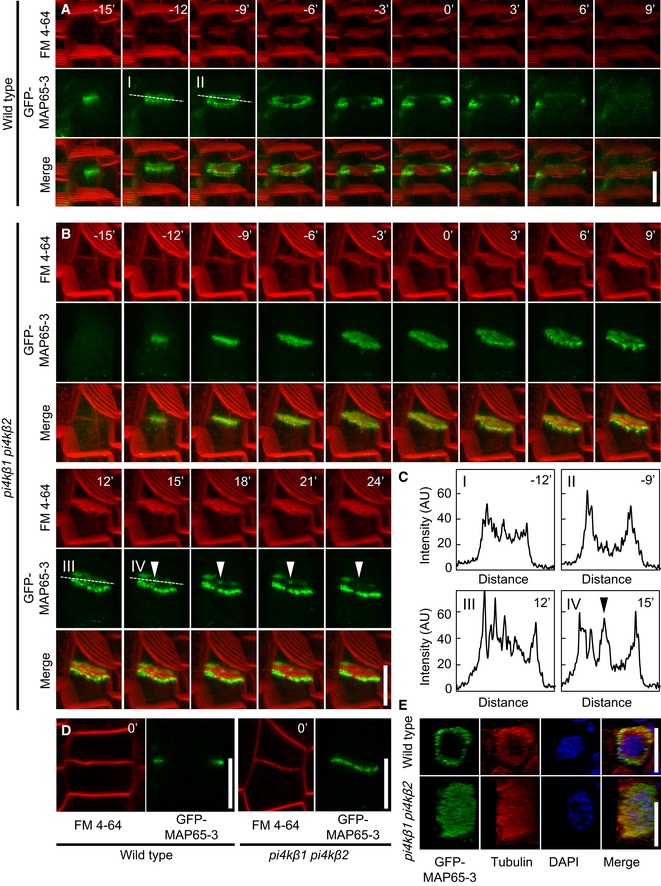
The dynamics of the microtubule bundling protein, MAP65‐3, were recorded in live‐cell time‐lapse analyses of cytokinetic cells from root tips of wild‐type controls and
pi4kβ1 pi4kβ2 double mutants.
Image series of 3D projections of GFP‐MAP65‐3 costained with FM 4‐64 in root tips of 4‐day‐old wild‐type seedlings. The best angle for visualization was obtained by rotation of the x‐axis. Images are representative for 8 cells from 5 roots. Scale bar, 10 μm.
Image series of 3D projections of GFP‐MAP65‐3 costained with FM 4‐64 in root tips of 4‐day‐old pi4kβ1 pi4kβ2 seedlings. The best angle for visualization was obtained by rotation of the x‐axis. Images are representative for 11 cells from 10 roots. Arrowheads, persisting signal of GFP‐MAP65‐3 in the center of the cell division plane. Scale bars, 10 μm.
Plot profiles were obtained from medial confocal planes at time points displaying the transition from disk to ring phragmoplasts, marked by dashed lines in (A) and (B). Arrowhead, persisting signal of GFP‐MAP65‐3 in the center of the cell division plane.
Medial confocal planes from z‐stacks from (A) and (B) demonstrating attachment of the FM 4‐64‐stained cell plate with the peripheral plasma membrane, defining t0. Scale bars, 10 μm.
3D reconstruction of ring‐ and disk‐shaped immunofluorescence patterns for GFP‐MAP65‐3 and microtubules, based on super‐resolution structured illumination microscopy (SIM), costained with DAPI. Top panels, wild type; bottom panels, pi4kβ1 pi4kβ2 double mutants. Scale bars, 10 μm.
Data information: Times in (A–C) are given relative to the instance when the cell plate contacted the peripheral plasma membrane, defined as t0.

