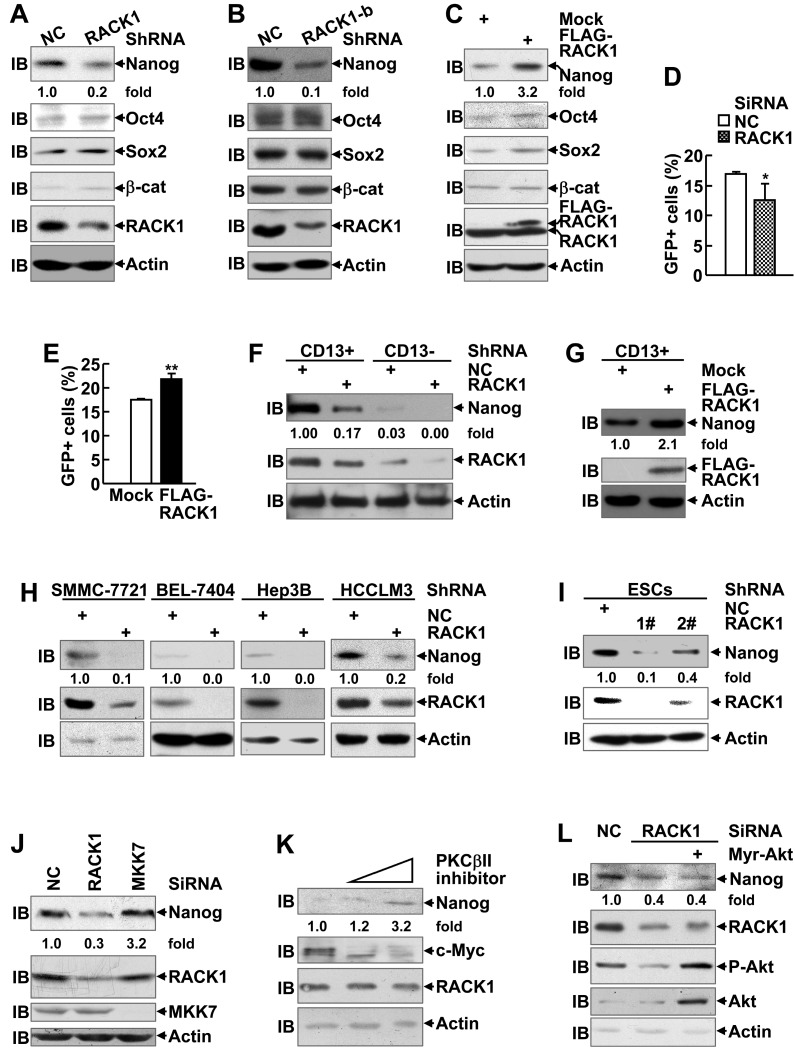
Figure 2.
Enhancement of Nanog expression by RACK1 in human HCC cells and murine ESCs. (A-C) Immunoblotting analysis of the expression of the indicated stemness-associated genes upon RACK1 knockdown (A,B) or over-expression (C) in HuH7 cells. (D,E) Analysis of Hedgehog signaling activity upon RACK1 knockdown (D) or over-expression (E) in HuH7 cells as indicated by 7Gli-GFP reporter. mean±s.d. (n=3); *P<0.05, **P<0.01. (F-I) Immunoblotting analysis of Nanog expression upon RACK1 knockdown (F,H,I) or over-expression (G) in sorted CD13+ and CD13- HuH7 subpopulations (F,G), in other human HCC cells (H), or in murine ESCs (I). (J,L) Comparison of Nanog expression by immunoblotting 48 h after SMMC-7721 cells were transfected with the indicated siRNAs and a mammalian expression vector encoding Myr-Akt. (K) Immunoblotting analysis of Nanog expression after SMMC-7721 cells were treated with CGP53353 (0, 5, 10 μM) for 48 h. Numbers below the blots are the density of Nanog quantified by scanning densitometry, normalized to Actin, relative to that of the control group.

