Figure 3.
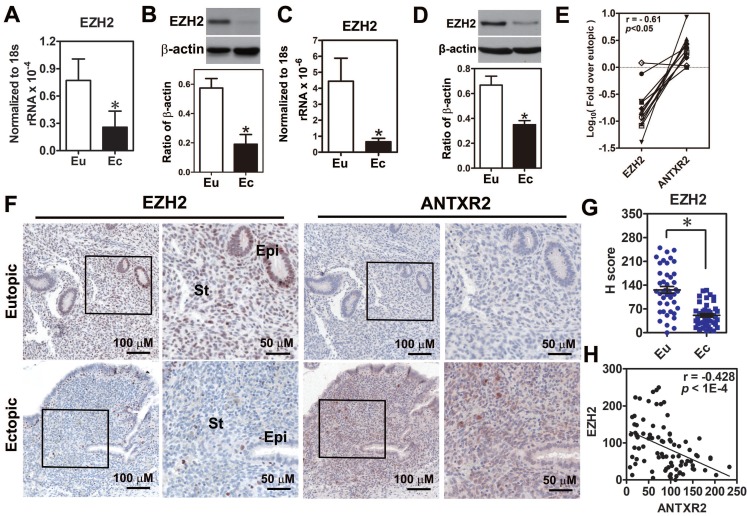
Loss of EZH2 expression had a negative correlation with ANTXR2 level in endometriotic specimens. (A) Levels of EZH2 mRNA (n = 12) and (B) protein (n = 8) in paired eutopic (Eu) and ectopic (Ec) endometrial specimens. (C) Levels of EZH2 mRNA (n = 5) and (D) protein (n = 5) in the primary isolated eutopic and ectopic stromal cells. (E) EZH2 and ANTXR2 mRNA levels were presented as fold over eutopic tissues. EZH2 and ANTXR2 levels from the same patient were linked by a solid line (n = 12). (F) EZH2 and ANTXR2 IHC staining were individually performed by using eutopic (n = 43) and endometriotic (n = 42) specimens. Representative IHC pictures of EZH2 (left panel) and ANTXR2 (right panel) were showed as two magnifying power, respectively. (G) EZH2 staining was quantified as H score. Eu: eutopic stromal cells; Ec: ectopic stromal cells. St: stromal cell; Epi: epithelial cell. (H) The correlation analysis by using EZH2 and ANTXR2 H scores including eutopic and ectopic specimens (n = 85). The asterisk indicates P < 0.05. Results were presented as means ±SEM.

