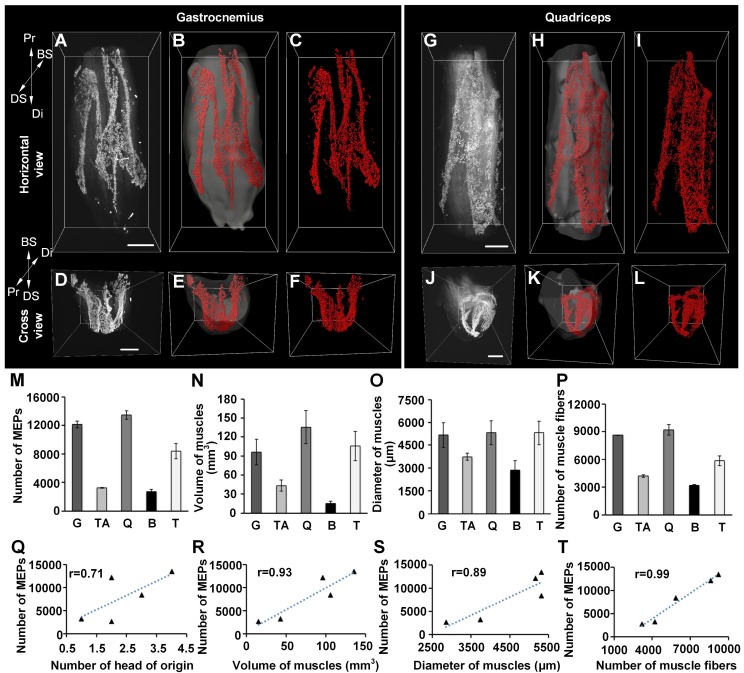
Figure 2.
Three-dimensional distributions of MEPs in different skeletal muscles. (A-L) Three-dimensional reconstruction of MEPs in the gastrocnemius and quadriceps. A and G show the horizontal view of raw image stacks (white). B and H show the segmentation of muscle surfaces (light gray) and MEPs (red). C and I show the MEPs (red). D, E, F, J, K, and L reveal the cross-sectional view corresponding to A, B, C, G, H, and I. Three-dimensional reconstructions of the tibialis anterior, biceps, and triceps are shown in Figure S5. BS: bone surface; Di: distal end; DS: dorsal surface; Pr: proximal end. Scale bar: 1000 μm. (M-P) The statistical results of different muscles (n = 3 for each muscle): the total number of MEPs (M), volume (N), maximum diameter (O), and number of muscle fibers (P). B: biceps; G: gastrocnemius; Q: quadriceps; T: triceps; TA: tibialis anterior. Data are presented as the mean ± s.d. (Q-T) The correlation analysis between the number of MEPs and each of the following parameters: the number of the head of origins (Q), volume (R), diameter (S), and fiber number (T) of muscles.

